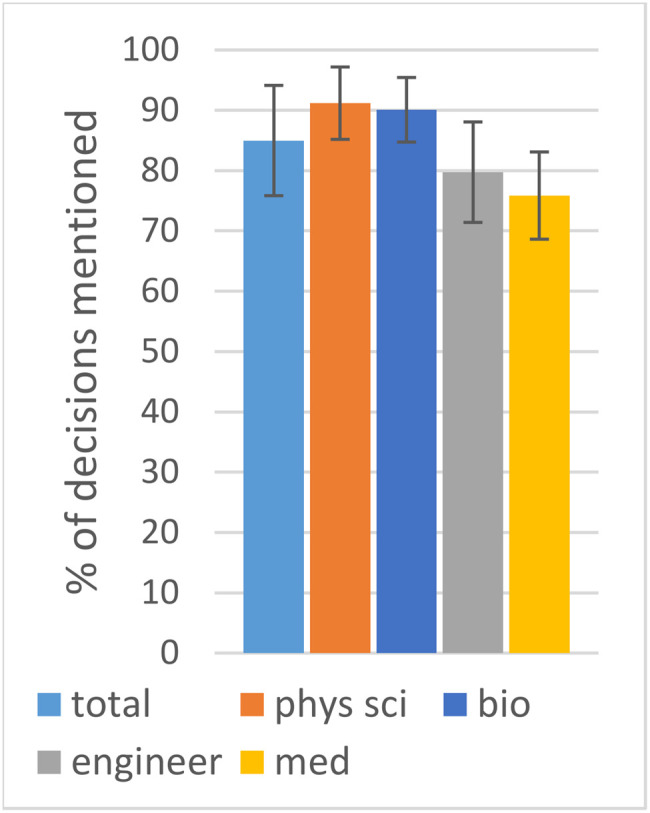
FIGURE 2.

Proportion of decisions coded in interviews by field. This tabulation includes decisions 1–29, not the additional themes. Error bars represent standard deviations. Number of interviews: total = 31; physical science = 9; biological science = 8; engineering = 8; medicine = 6. Compared with the sciences, slightly fewer decisions overall were identified in the coding of engineering and medicine interviews, largely for discipline-specific reasons. See Supplemental Table S2 and associated discussion.
