
FIGURE 1.
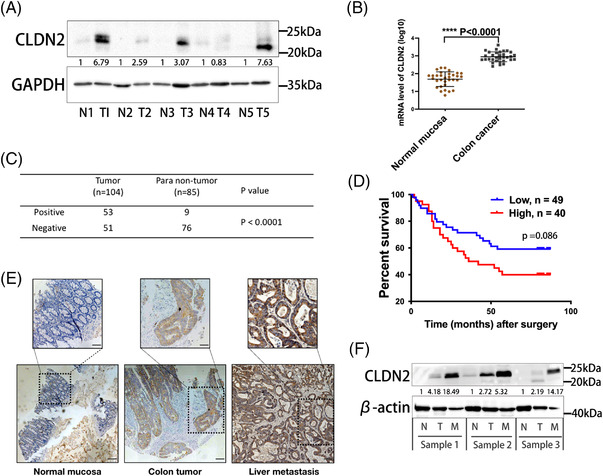
CLDN2 is upregulated in colorectal cancers and associated with poor survival. (A) Representative band of CLDN2 levels in five paired colorectal cancer and adjacent normal tissues by western blot analysis; Image J was used for bands quantification and the bands were normalised to GAPDH. (B) Relative mRNA expression of CLDN2 in public TCGA datasets (GDS2947); p value was calculated with t‐test. (C) Statistical analysis of CLDN2 IHC expressions from 189 paraffin‐embedded human colorectal cancer tissues; p value was calculated with chi‐square test. (D) Overall survival of 89 colorectal cancer patients stratified by low versus high CLDN2 expression. (E) Representative image of IHC staining for CLDN2 in adjacent normal mucosa, colorectal tumour tissue and liver metastasis tissue; scale bar, 100 μm (lower panel), 50 μm (upper panel). (F) Representative band of CLDN2 levels in three paired normal mucosa, colorectal cancer and liver metastasis tissues by western blot analysis; Image J was used for bands quantification and the bands were normalised to β‐Actin