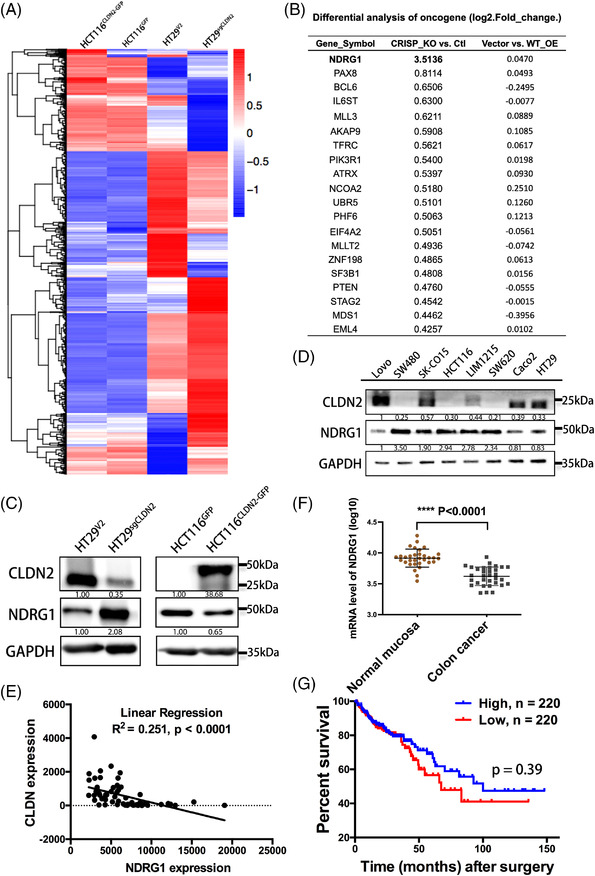
FIGURE 3.

CLDN2 suppresses downstream NDRG1 expression. (A) Heatmap depiction of differentially expressed genes between CLND2 knockout and CLDN2 overexpression cells (n = 1). (B) List of top 20 tumour‐related factors, log2 fold‐change value represents that gene changes. (C) Western blot analysis of NDRG1 level in cells with either CLDN2 knockout or CLDN2 overexpression. (D) Relationship of CLDN2 and NDRG1 expression in eight colorectal cell lines as detected by western blot analysis. (E) mRNA quantification of co‐expression for CLDN2 and NDRG1 on public colorectal cancer datasets (GDS2947); p value was calculated with Pearson's correlation analysis. (F) Relative mRNA expression of CLDN2 in public TCGA datasets (GDS2947); p value was calculated with t‐test. (G) Overall survival of 440 colorectal cancer patients stratified by low versus high CLDN2 expression in public database (survival data based on mRNA expression levels at http://www.oncolnc.org/)
