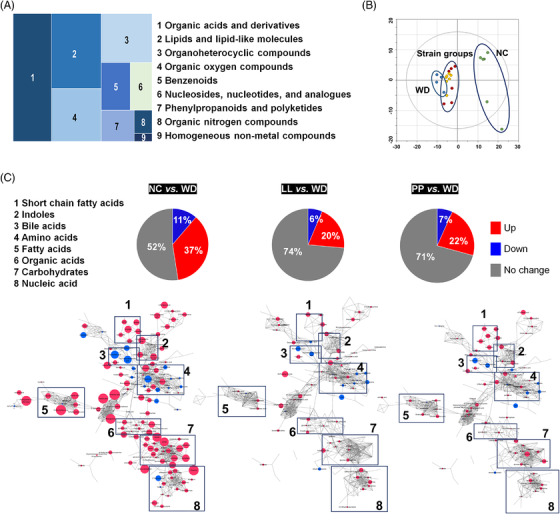
FIGURE 4.

The caecal metabolomic dysregulation by Western diet and the normalization by the supplementation with L. lactis and P. pentosaceus . (A) Chemical classification of identified metabolites in mouse caecum provided by HMDB (http://www.hmdb.ca). A total of 256 compounds (91%) are categorized into nine super classes. (B) The score scatter plot of 282 caecal metabolites by principal component analysis (PCA). Most variation was imposed by PC1 (30.8%) and PC2 (12.3%). *p < 0.05 as compared with WD. (C) Overview of the metabolic features. Pie charts present the number of metabolites that were significantly different in other groups, respectively compared to WD (Student's t‐test, p < 0.05). Red and blue colours present significantly higher or lower abundance in other groups, respectively compared to WD (p < 0.05). The network is constructed based on chemical structural similarity (Tanimoto score) and KEGG reaction pair (substrate‐product relation), which results in distinctive metabolic modules indicated by box. Red and blue colours present significantly higher or lower abundant in NC, LL, and PP groups, respectively compared to WD (Student's t test, p < 0.05). Node sizes are determined by the ratios. HMDB, human metabolome database; KEGG, Kyoto encyclopedia of genes and genomes; LL, Lactobacillus lactis; NC, normal control; PC1, Climatic index 1; PC2, Climatic index 2; PP, Pediococcus pentosaceus; WD, Western diet
