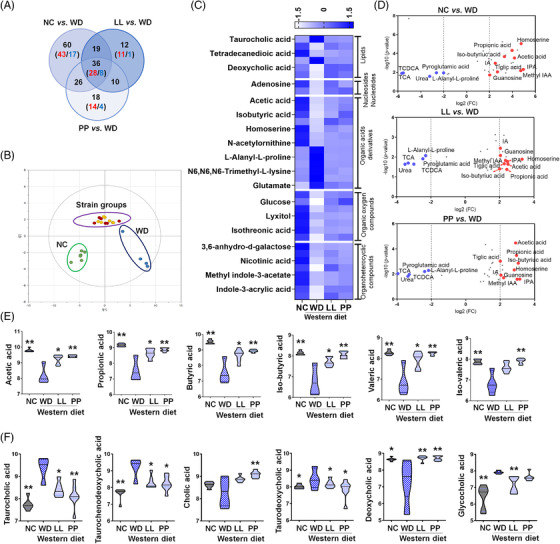
FIGURE 5.

The characteristic alteration in the major caecal metabolites according to different diet types and strains supplementation. (A) The metabolites that show common abundance pattern in other groups compared to WD group. A total of 36 metabolites are significantly different in all three groups. (B) The score scatter plot of the 36 metabolites by principal component analysis. (C) Heatmap of auto‐scaled abundances (mean‐centered and divided by the standard deviation of each variable) of the common metabolites. (D) Volcano plot of the common metabolites (36 metabolites) that are significantly different in all three groups, respectively compared to WD group. The x‐axis is log2‐fold change, and the y‐axis is log10‐p value. Indole derivatives (indole‐3‐propionic acid and methyl indole‐3‐acetic acid) show the highest fold‐increases in all three groups. Bile acids (taurocholic acid and taurochenodeoxycholic acid) present the highest fold‐decreases in all three groups. The name of metabolites in common among three groups is only visualized. The levels of caecal short chain fatty acids (SCFAs) (E) and bile acids (BAs) (F) in different diet groups (n = 4–7). The log10‐transformed abundances (ion intensities) are shown as violin plot. *p < 0.05 as compared with WD group by Mann–Whitney U test. **p < 0.05 as compared with WD group by nonparametric Kruskal–Wallis test and Dunn's test adjusted by Benjamini‐Hochberg correction. LL, Lactobacillus lactis; NC, normal control; PP, Pediococcus pentosaceus; WD, Western diet
