FIGURE 7.

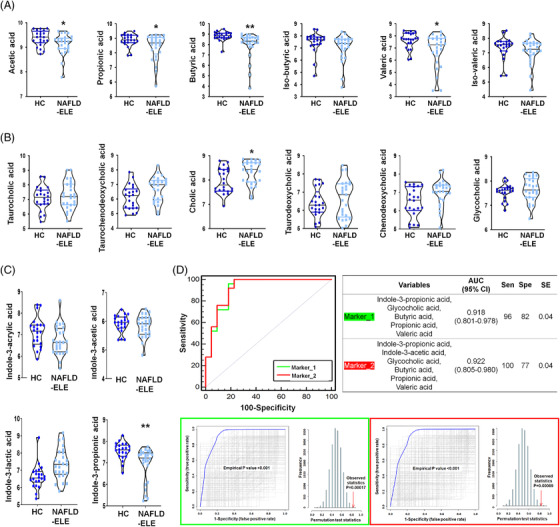
Human faecal metabolomic features in the non‐alcoholic fatty liver disease (NAFLD) patients. The levels of human faecal short chain fatty acids (SCFAs) (A), bile acids (BAs) (B), and indoles (C) in two different groups, healthy control (HC) (n = 22) and the patients with NAFLD‐elevated liver enzyme (ELE) (n = 25). The log10‐transformed abundances (ion intensities) are shown as violin plot. *p < 0.05 as compared with HC group based on Student's t‐test. **p < 0.05 as compared with HC after multiple comparison adjustment by false discovery rate. (D) Receiver operating characteristic (ROC) curve analysis of biomarker panel included by multiple faecal metabolites for discriminating the HC (n = 22) and non‐alcoholic steatohepatitis (NASH) (n = 25). Each biomarker cluster includes Marker_1 (indole‐3‐propionic acid, glycocholic acid, propionic acid, butyric acid, valeric acid), Marker_2 (indole‐3‐propionic acid, indole‐3‐acetic acid, glycocholic acid, propionic acid, butyric acid, valeric acid). The area under curve value is 0.918 (95% confidence interval: 0.801–0.978) and 0.922 (95% confidence interval: 0.805–0.980), respectively. Optimal cutoff is determined using the closest to top‐left corner, and the 95% confidence interval is calculated using 1000‐bootstrapping. The area under ROC curve and predicative accuracy are calculated through 1000 times permutation test
