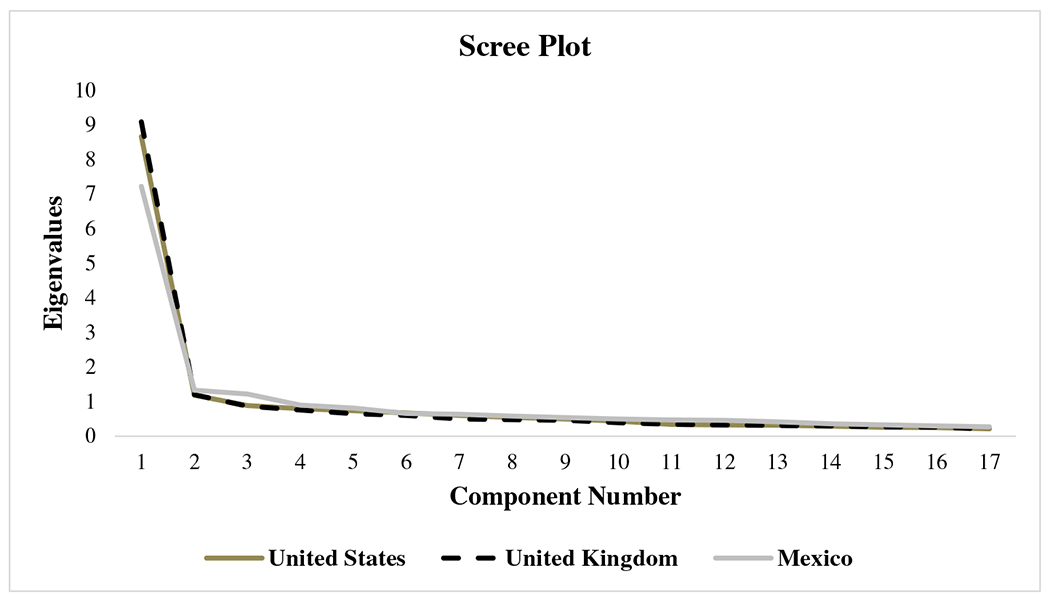
Fig. 1.

Scree plots for the Man Box Scale.
Scree plot demonstrating the resulting Eigenvalues from the exploratory factor analysis for the United States, United Kingdom, and Mexico samples.

Scree plots for the Man Box Scale.
Scree plot demonstrating the resulting Eigenvalues from the exploratory factor analysis for the United States, United Kingdom, and Mexico samples.