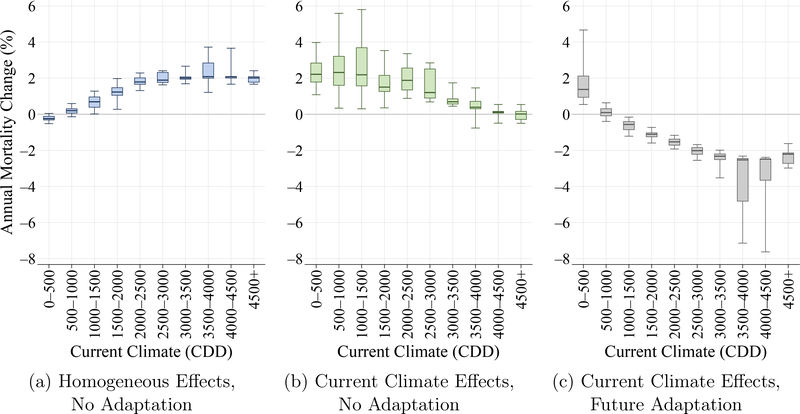
Figure 5:
End-of-Century Climate Change Mortality Effects
Notes: The figure summarizes annual mortality effects of end-of-century (2080–2099) climate change as projected by the meta-model, an average of the 21 NEX-GDDP climate models, under the RCP 8.5 emissions scenario. Effects are calculated for each ZIP code based on the ZIP code’s current and future (projected) climates. Panel A reports climate effects under the assumption of homogeneous temperature effects. Panel B reports climate effects that allow for heterogeneous temperature effects based on current climate but do not allow for future adaptation. Panel C reports climate effects that incorporate both current heterogeneity and future adaptation. Box and whisker plots summarize the distribution of climate change effects across ZIP codes in each climate range. Boxes stretch from the 25th percentile (lower hinge) to the 75th percentile (upper hinge). The median is plotted as a line across the box. Whiskers stretch from the 5th percentile to the 95th percentile.

