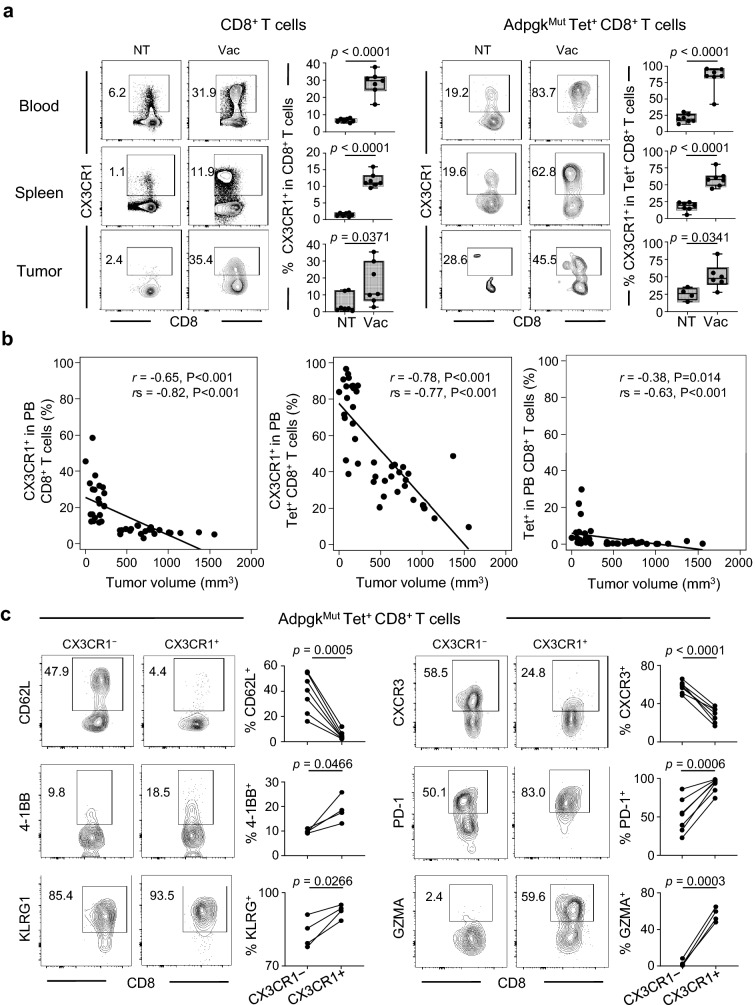
Fig. 2.
Effective neoantigen/TLR3/CD40 stimulations correlate with generation of antigen-specific effector CX3CR1+ CD8+ T cells. a–c, MC38 tumor-bearing C57BL/6 mice were treated with PBS (NT) or AdpgkMut/TLR3/CD40 agonists vaccination (Vac) as described in Fig. 1a. Blood, spleens and tumors were collected 1 week after 2nd Vac. a Representative FACS plots showing CX3CR1 expression in CD8+ (left) or AdpgkMut tetramer (Tet)+ CD8+ T cells (right) in PB (upper), spleen (middle) and tumors (lower). Numbers denote percentage of CX3CR1+ cells. Frequency of CX3CR1+ cells from the CD8+ or Tet+ CD8+ T cells is shown in the right panels (n = 4–7 mice per group). b Scatter plot of the frequency of PB CX3CR1+ CD8+ T cells (left), CX3CR1+ Tet+ CD8+ T cells (middle), and Tet+ CD8+ T cells (right) against tumor volume. Correlation is shown using Pearson correlation (r) and Spearman correlation coefficients (rs). c Representative FACS plots of CX3CR1− (left) or CX3CR1+ (right) cells gated with Tet+ CD8+ T cells in PB. Numbers denote percentage of each marker-positive cells. Frequency of marker-positive cells from the CX3CR1− or CX3CR1+ subset is shown in the right panels for each marker (n = 4–7 mice per group). Data shown are representative of at least two independent experiments (a–c). Two-tailed unpaired (a) and paired t-test (c). Box plots: hinges, 25th and 75th percentiles; middle line, median; whiskers, minimum to maximum value (a)

