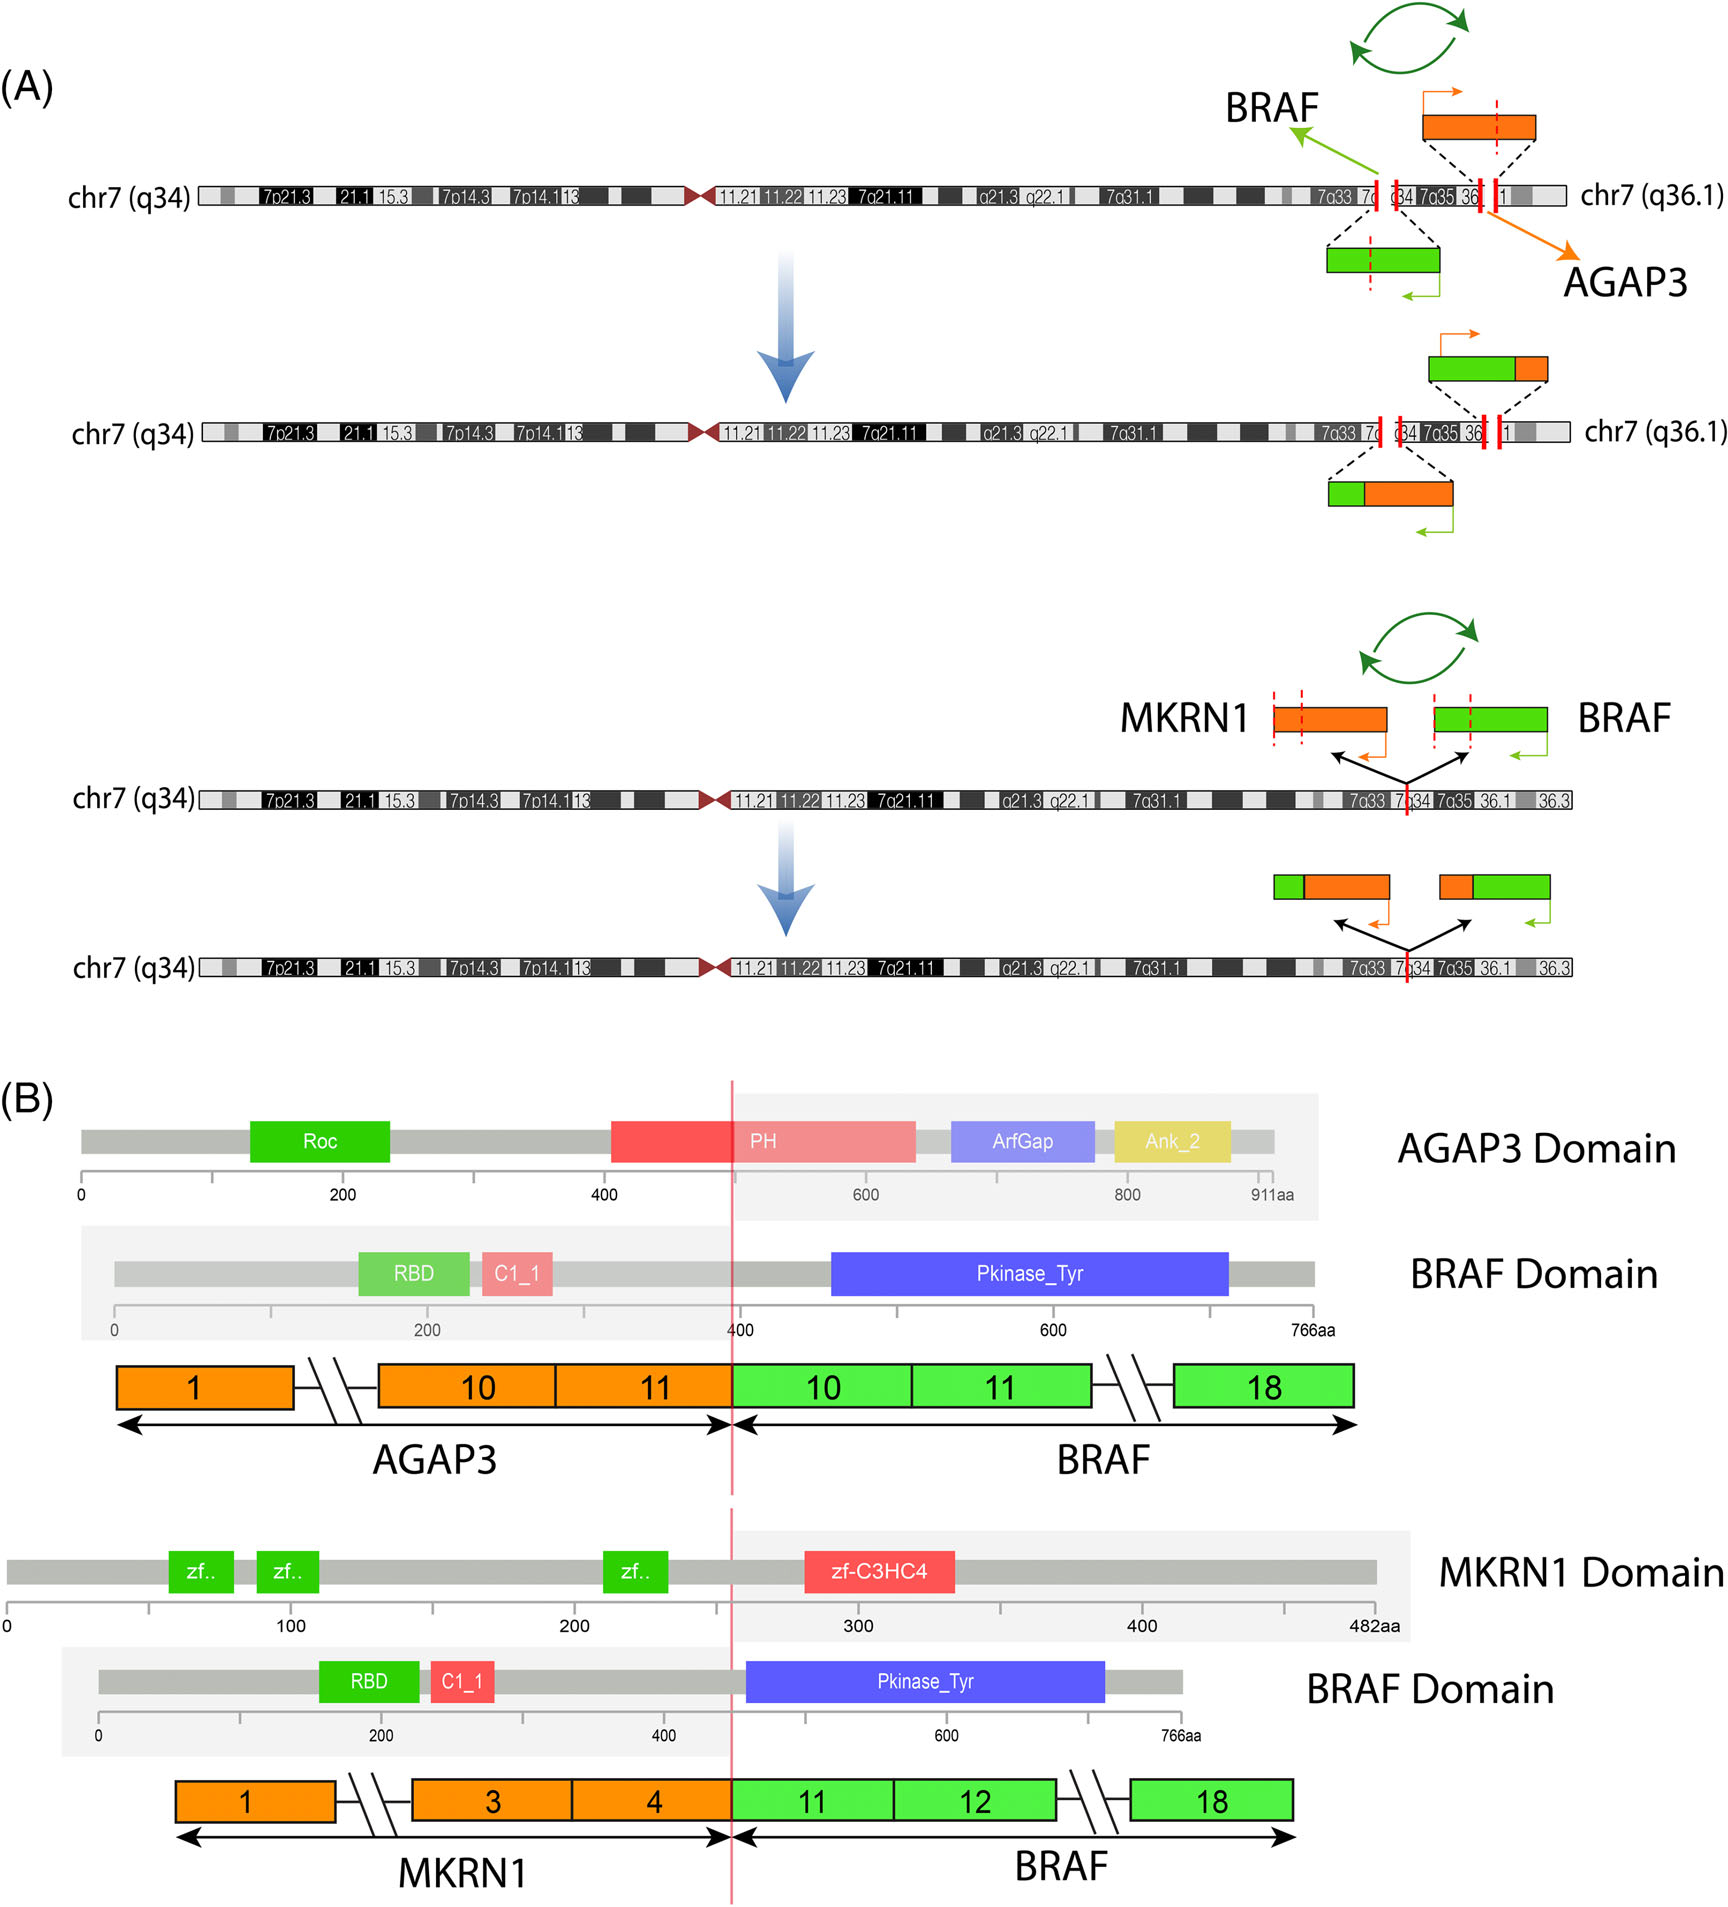
FIGURE 3.

Diagrammatic representation of the two intrachromosomal BRAF fusions. (A). Schematic view of BRAF gene location on 7q34 (green box) and its two fusion partners AGAP3 on 7q36.1 and MKRN1 on 7q34 (orange boxes). The direction of transcription of each gene is shown by an orange or green arrow. Green circular arrows indicate that both fusions result from a complex process of break, inversion, and fusion, resulting in a functional transcript retaining the BRAF kinase domain as the 3' partner in both cases. (B). Upper portion reveals a fusion transcript composed of AGAP3 exon 11 fused to exon 10 of BRAF; while the lower portion shows MKRN1 exon 4 fused to exon 11 of BRAF. In both cases, the projected fusion oncoprotein retains the BRAF kinase domain intact. The protein domains of the participating genes are also displayed
