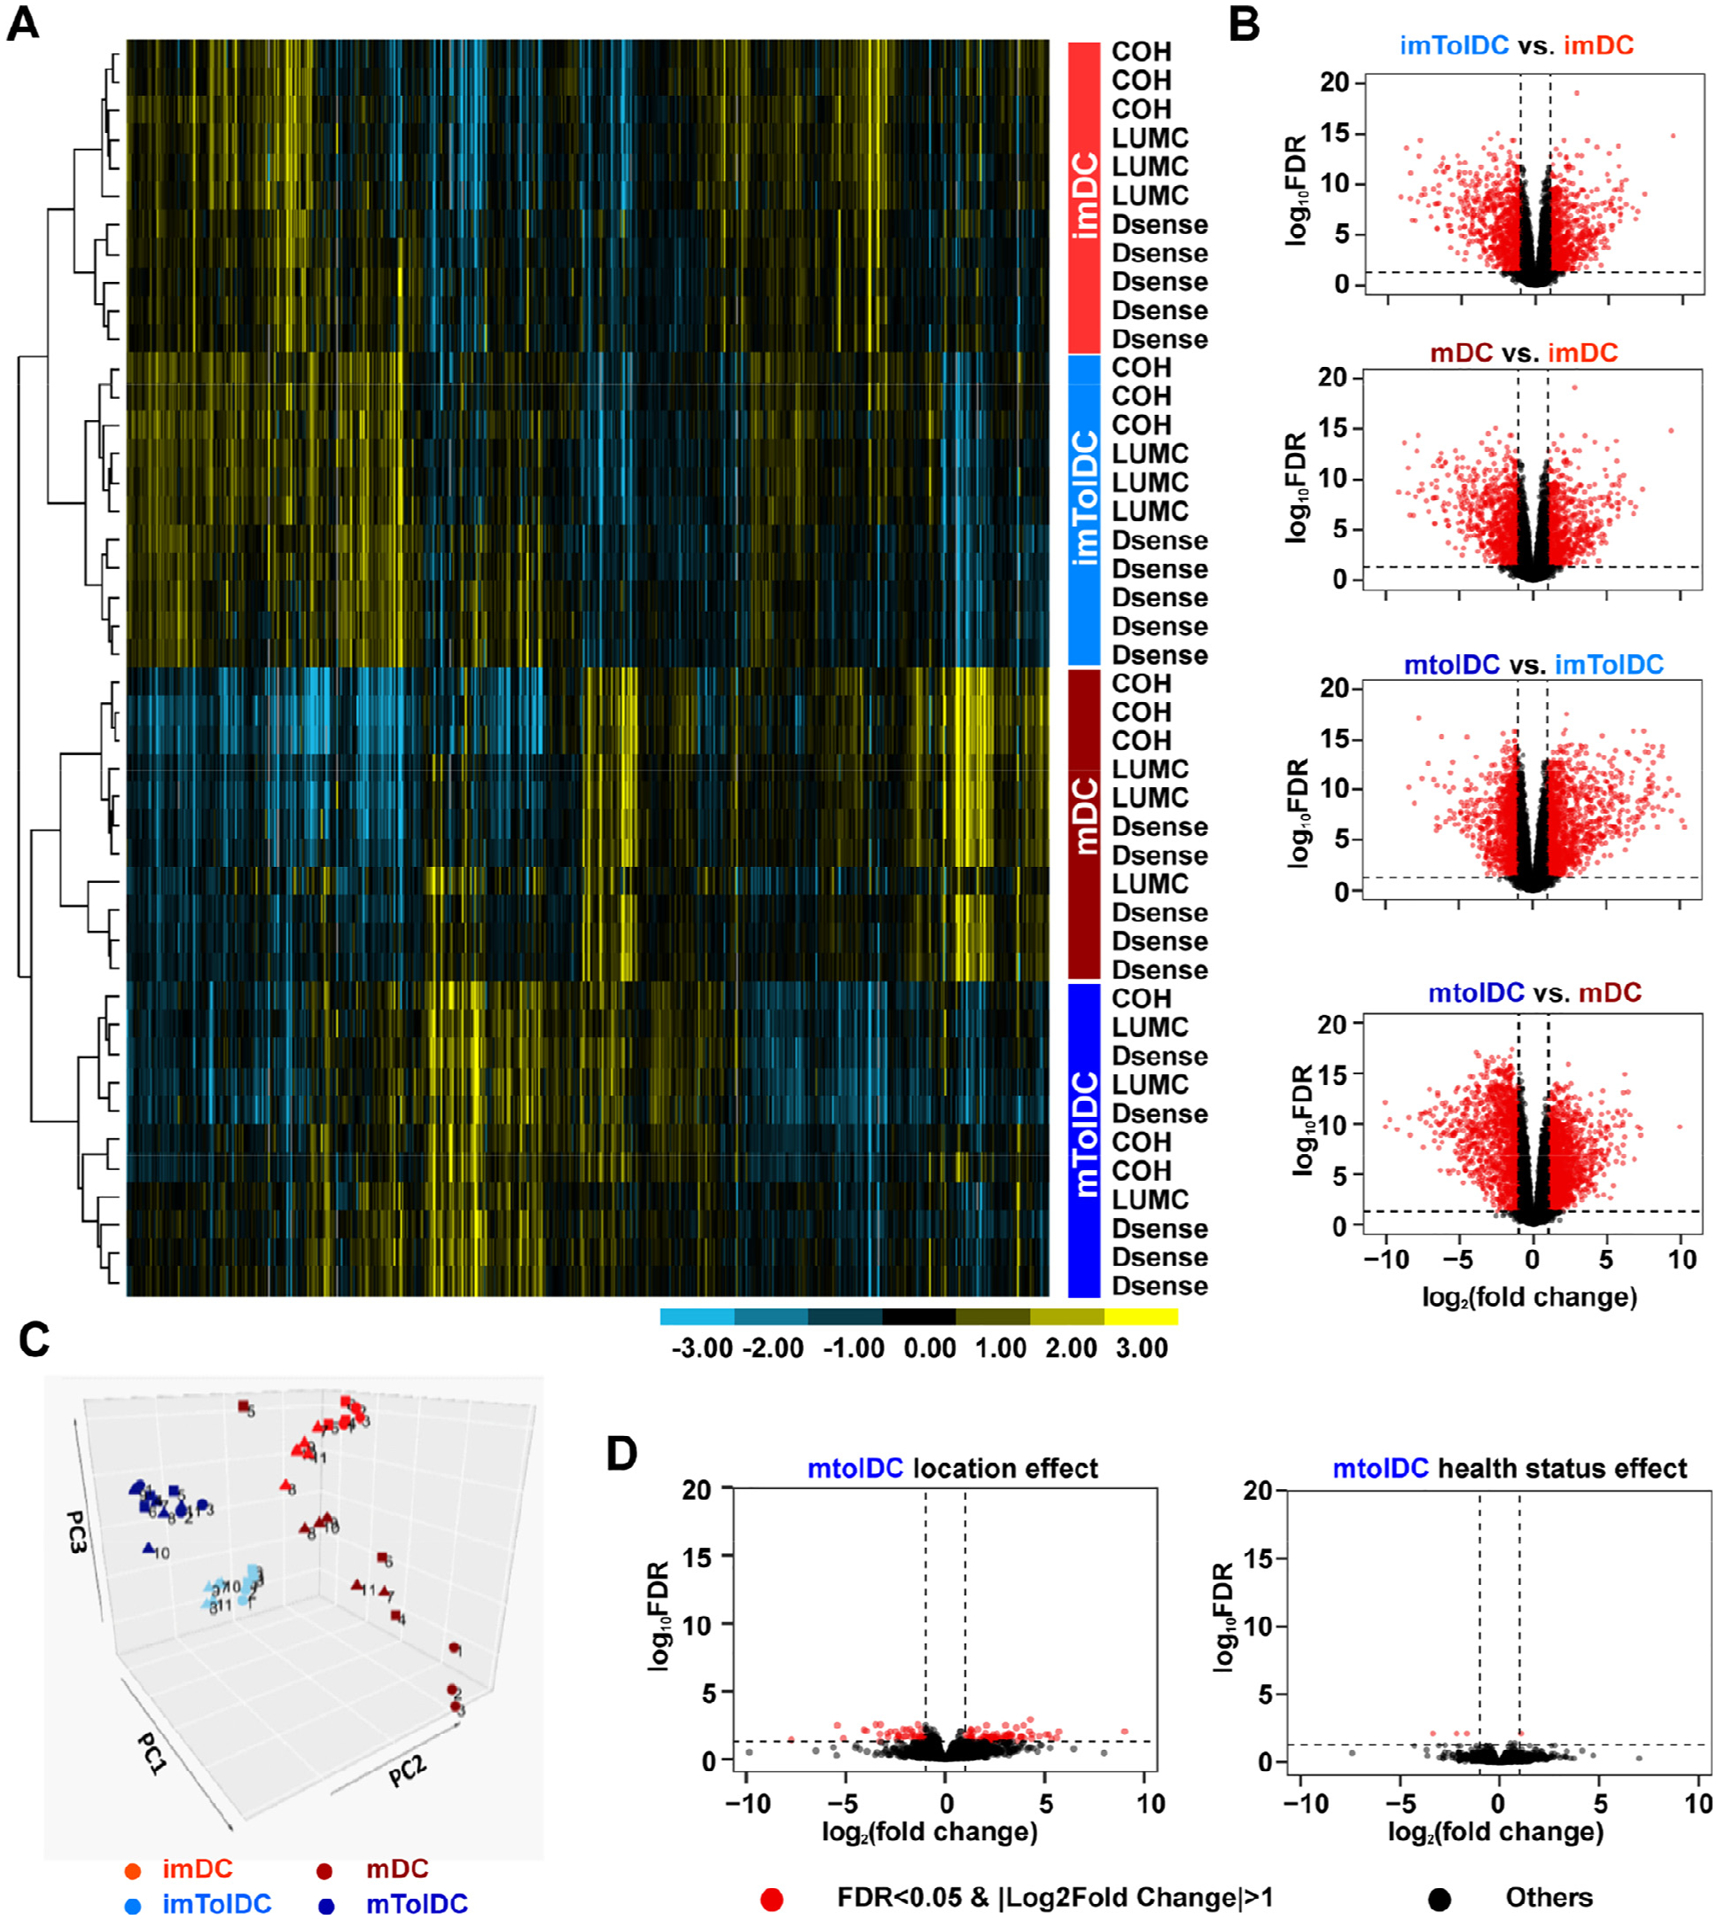
Figure 3.

Transcriptomic analysis of tolDCs reveals that they are unaffected by location or T1D status and are more similar to their immature state than inflammatory DCs. RNA was isolated at the immature and mature stages of DC production, and RNA-seq was performed on Illumina HiSeq 2500. Samples clustered based on cell types, which are shown in the colored box to the right of the heatmap. Inflammatory imDCs are shown in light red, mDCs in dark red, imtolDCs in light blue and mtolDCs in dark blue. (A) Unsupervised hierarchical clustering of approximately 10% of 10,854 expressed genes (selected from the 21,121 genes using criterion RPKM > 1 in at least four samples). Each row represents one sample, which is labeled by location to the right of the heatmap, with the color of the label designating the cell type. Data show that samples clustered on cell type rather than location or health status. (B) Volcano plots depict DEGs in different cell type comparisons. For all volcano plots, red dots represent significant genes with an FC > 2 and FDR < 0.05, and black dots represent all other expressed genes. For a zoomed in view of volcano plots and identities of DEGs, see supplementary Figures 3–8. (C) PCA plot of all samples. Squares indicate samples from COH, circles from LUMC and triangles from D-Sense. (D) Volcano plots comparing location and health status in mtolDCs. FDR, false discovery rate; imDC, immature DC; imtolDC, immature tolDC; mtolDC, mature tolDC; PCA, principal component analysis.
