
Figure 6.
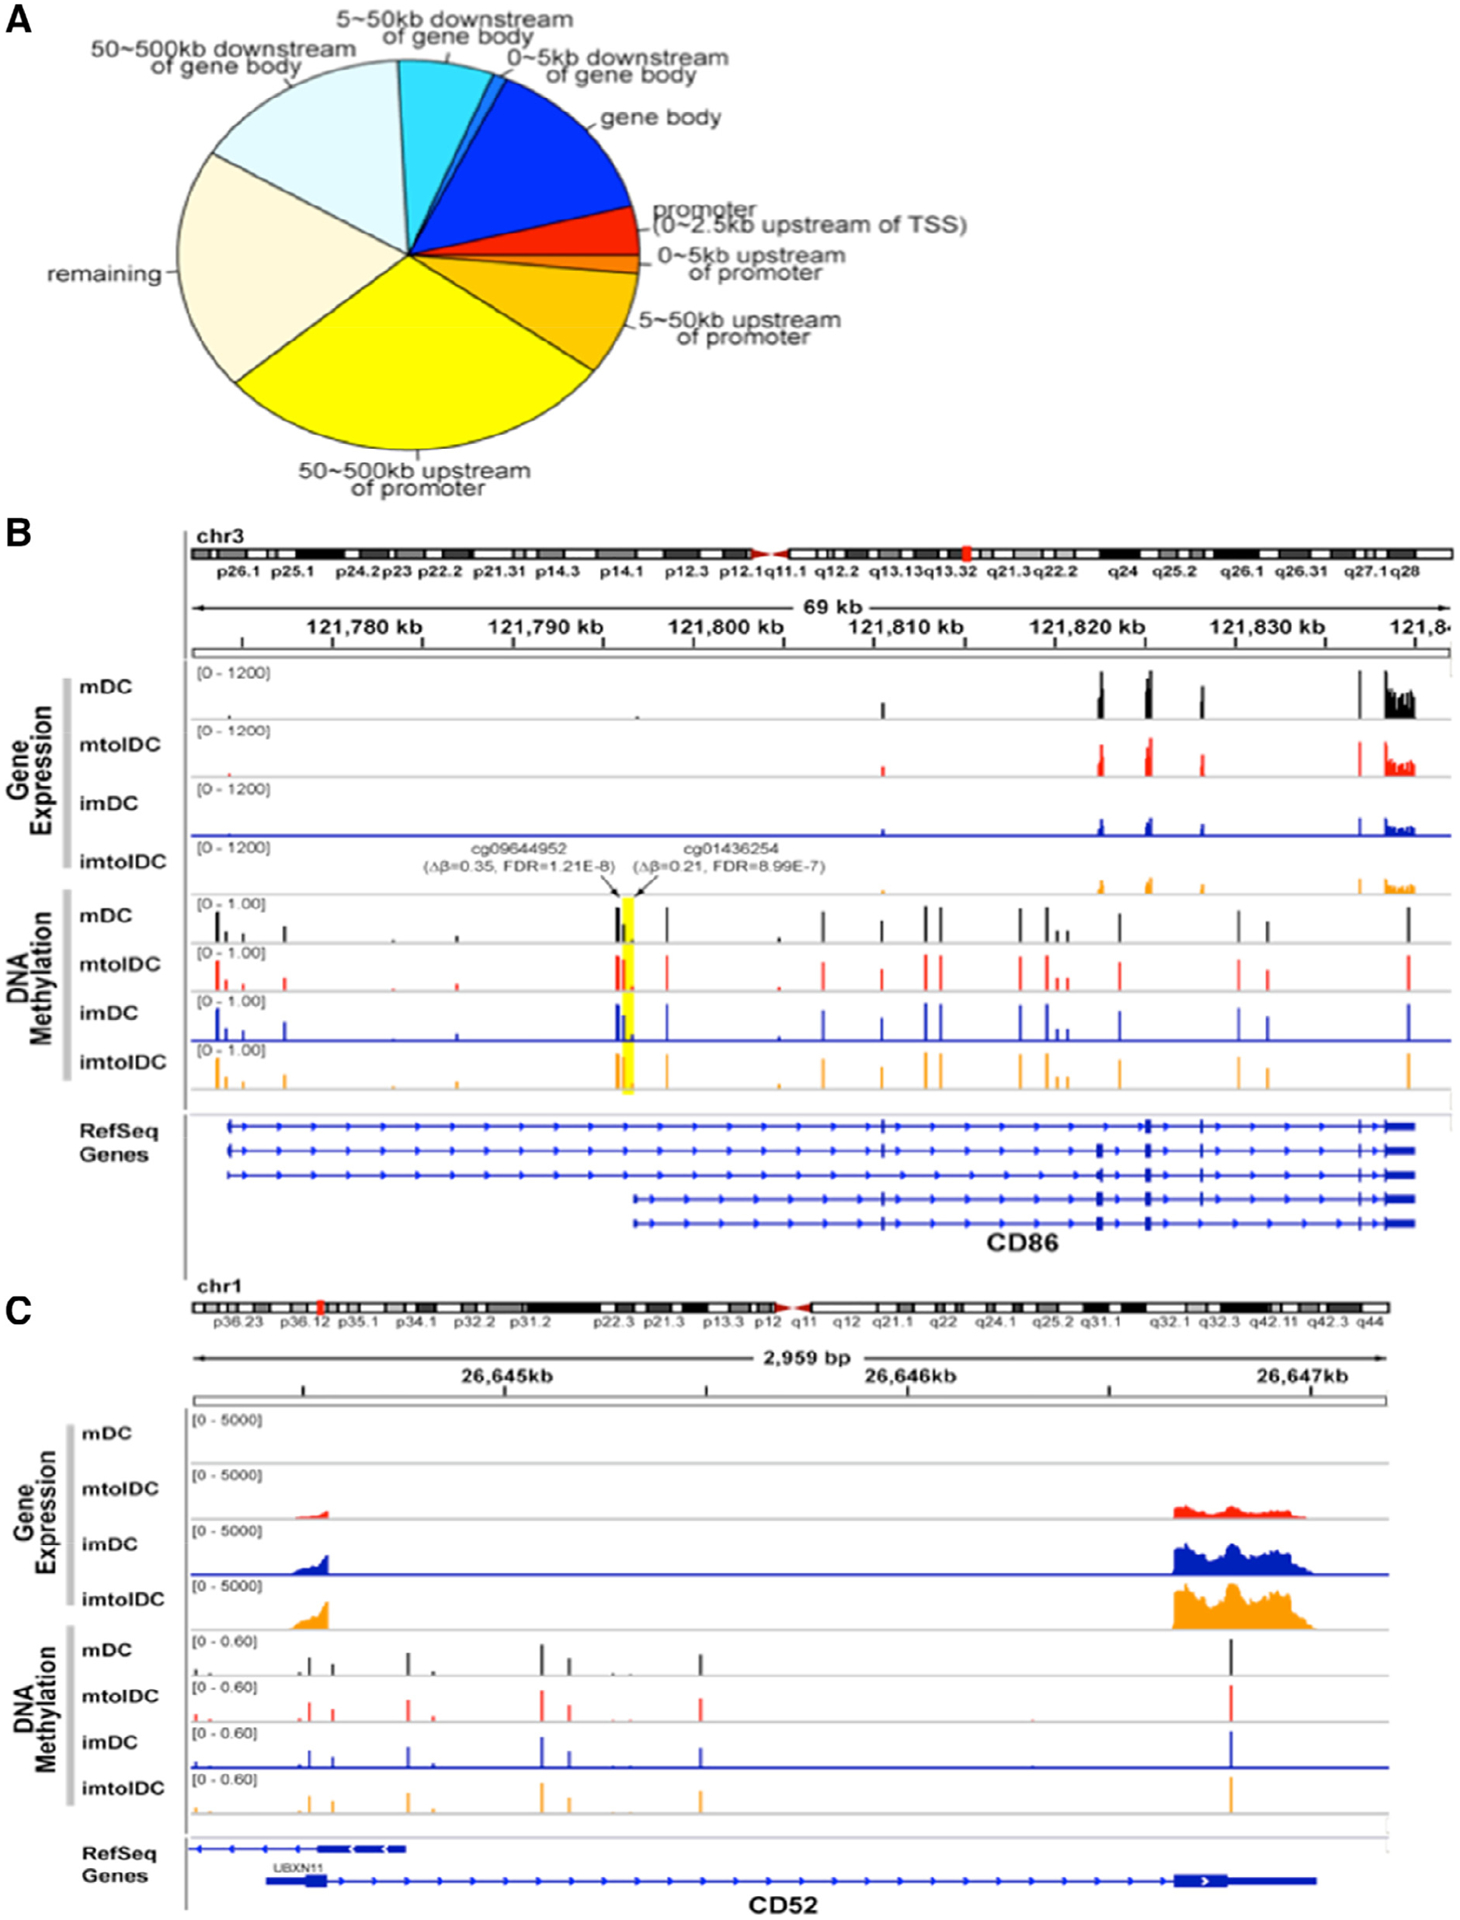
The majority of DEGs are associated with DMRs between mature tolerogenic and inflammatory DCs. (A) Pie chart representing all DEGs, categorized depending on the genomic location of DMCs associated with that DEG. The promotor region was identified as being 0–2.5 kb upstream of the TSS. When there was no associated DMC with that DEG, it was categorized as “remaining.” (B) Methylation of the CD86 gene. Average gene expression of CD86 was obtained using the scaled coverage of the 11 samples in each group. Average DNA methylation level at each CpG on each group was calculated based on normalized DNA methylation level. Two DMLs (cg09644952 and cg01436254) were noted in the proximal promotor of CD86 (yellow highlighted area), and expression was lower in tolDCs compared with inflammatory DCs (log2FC = −0.49, Q = 0.009). (C) Similar methods were used for gene expression and DNA methylation of CD52. Although a significant difference in gene expression of CD52 was noted between tolerogenic and inflammatory DCs (log2FC = 4.48, Q < 0.0001), no DMLs near the gene body or in the promotor were observed. imDC, immature DC; imtolDC, immature tolDC; mtolDC, mature tolDC.