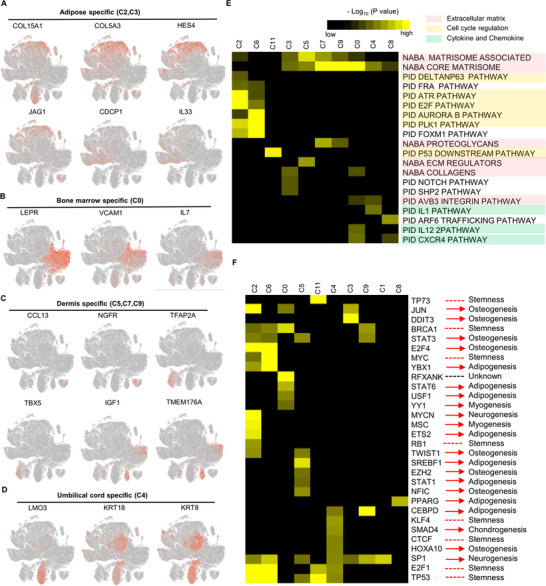
FIGURE 2.

Characterization of tissue‐specific subpopulations. (A–D) t‐SNE plot of reprehensive top10 marker genes on tissue‐specific mesenchymal stem cell (MSC) clusters, respectively. (A) Adipose, (B) Bone marrow, (C) Dermis, and (D) Umbilical cord. (E) Gene Ontology analysis of highly differential expressed genes (DEGs) for each cluster. The selected statistically top 20 canonical pathways were shown and coloured by the accumulative hypergeometric p‐values. (F) Heatmap of the predictive regulon activity was visualised using hierarchically clustering. The potential functions related to lineage differentiation were annotated manually, according to the published references. The black to yellow colouring indicates a relative p‐value in the legends.
