FIGURE 5.

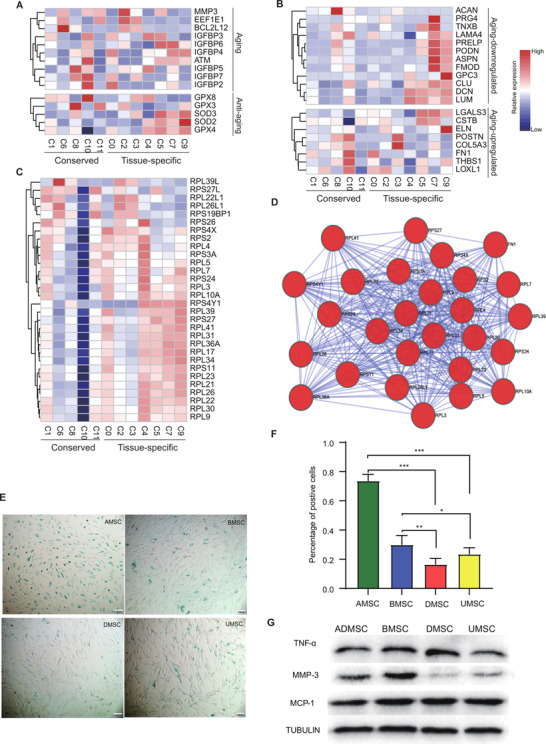
Ageing‐related heterogeneity revealed by single‐cell transcriptomes within conserved and tissue‐specific subpopulations. Using gene set enrichment analysis (GSEA) database to enrich ageing‐related genes. Heatmap showing the relative expression of ageing‐regulated genes (A), and down‐ or up‐regulated extracellular matrix (ECM) genes after ageing (B) within each subpopulation. (C) Heatmap showing the relative expression of ribosomal protein complexes from differential expressed genes (DEGs). The colour bar representing the relative gene expression. (D) Protein‐protein interaction mapping of these DEG genes. (E) Representative images of senescence‐associated‐β‐galactosidase (SA‐β‐gal) staining in multiple types of mesenchymal stem cells (MSCs). (F) Quantitative analysis of SA‐β‐gal staining. More than five fields were selected to calculate the percentage of positive cells for each donor. Each type of MSCs were collected from three donors (mean + SEM, *p < 0.05, **p < 0.01 and ***p < 0.001 by two‐way ANOVA test). (G) Representative western blotting showing related expression of TNF‐a, MMP3, and MCP1, compared to a‐tubulin in different types of MSCs.
