FIGURE 6.

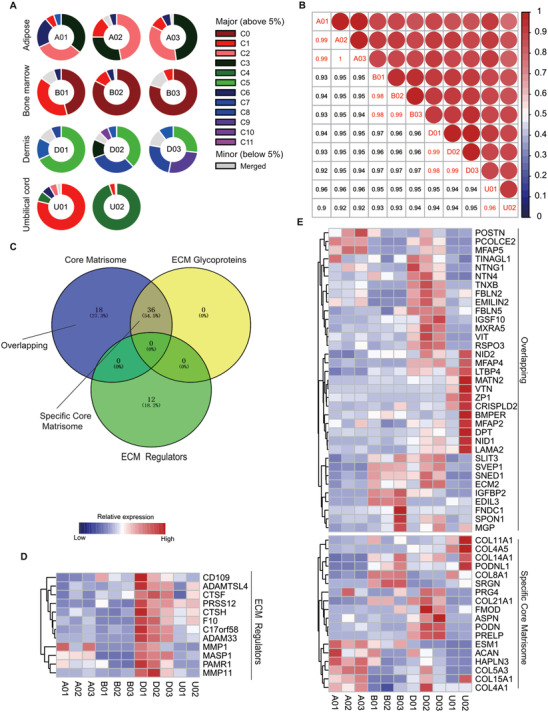
Donor‐derived heterogeneity of mesenchymal stem cells (MSCs) across multiple tissues. (A) The proportion of MSC subpopulations in each donor. The colour bar representing clusters with a high proportion (above 5%) and the grey bar encoding the merged clusters (less than 5%). (B) Correlation coefficient heatmap for different donor‐derived MSCs. The correlative value between each two‐individual donor on total differential expressed genes (DEGs). Colour legend (blue to red) encoding the value from 0 to 1. (C) Venn plot showing the overlapping DEGs in ECM associated terms. (D–E) The relative expression of genes within each ECM term: ECM regulators (D), overlapping and specific core matrisome (E). The expression was row‐scaled and coloured by low to high.
