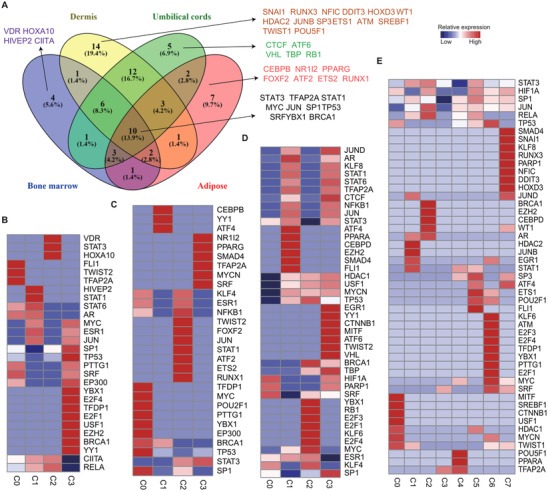
FIGURE 7.

Inferred transcriptional factor regulatory networks interpreting inter‐ and intra‐tissue mesenchymal stem cell (MSC) heterogeneity. Regulons are hierarchically clustered based on the activation pattern of transcriptional factors using TRRUST. (A) Venn diagram shows the tissue‐specific and overlapping transcription factors (TFs) by Venny. (B–E) Heatmap shows the p‐value for detailed TFs in intra‐subsets from each tissue. (B) Adipose, (C) Bone marrow, (D) Umbilical cords and (E) Dermis. The colour scale above the heatmap showed a range of –log p‐value. Red, high expression; blue, low expression.
