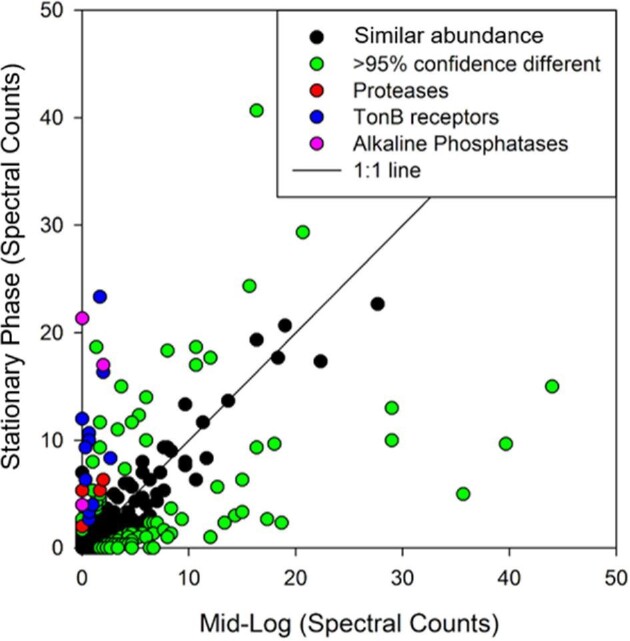
Fig. 10.

Comparison of protein abundance in Pseudoalteromonas (BB2-AT2) harvested at midlog (exponential) and stationary phases. Spectral counts of technical triplicates were averaged (see the Supplementary Material). Proteins with differing abundances according to Fisher's test 95% confidence interval are shown in green or other colors, while proteins not significantly different between treatments are shown in black. A number of proteases, TonB-dependent transporters, and alkaline phosphatase were more abundant at stationary phase, consistent with an adaptive response to depletion of nutrients.
