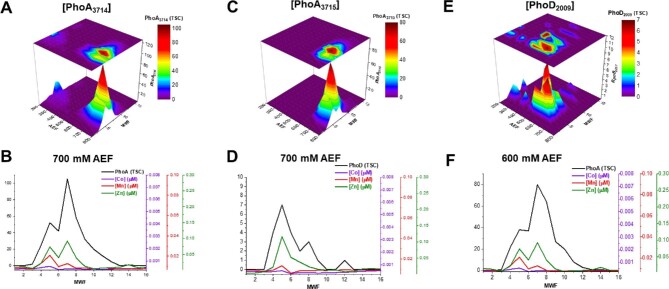
Fig. 4.
(A, C, E) Distribution of alkaline phosphatase enzymes in multidimensional chromatographic analysis and (B, D, F) comparison of these metalloproteins (with exclusive selection of the 700 and 600 mM AEFs, since these proteins were observed in highest abundance) compared with their corresponding distributions of Zn, Mn, and Co.

