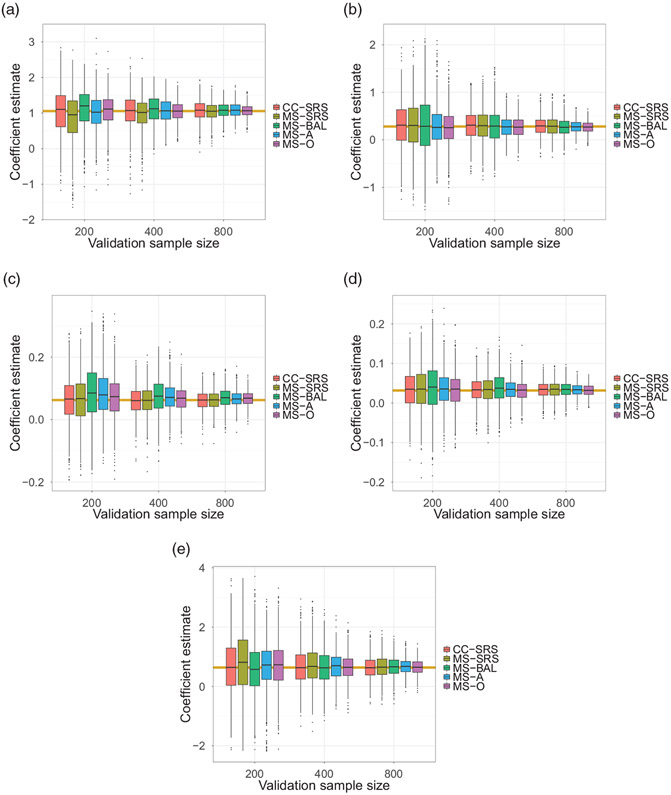
Figure 2.
The relative performance of different methods by repeatedly subsampling the phase two sample 1000 times from the reduced full cohort (N = 3757) of the NWTS data. For each validation sample size, the bundle of five box plots: complete case with simple random sampling (CC-SRS) and mean score with simple random sampling, balanced sampling, adaptive sampling and the oracle design (MS-SRS, MS-BAL, MS-A, and MS-O, respectively); shows relative performance. Efficient estimation results for each targeted covariate are shown in each panel; (a) unfavorable histology, (b) late stage of the disease, (c) age of diagnosis (year), (d) tumor diameter (cm), and the interaction between the histology and late stage, respectively, when validation sizes are n = 200, 400, 800. The yellow horizontal lines represent the reference parameter estimates obtained from the full cohort analysis.

