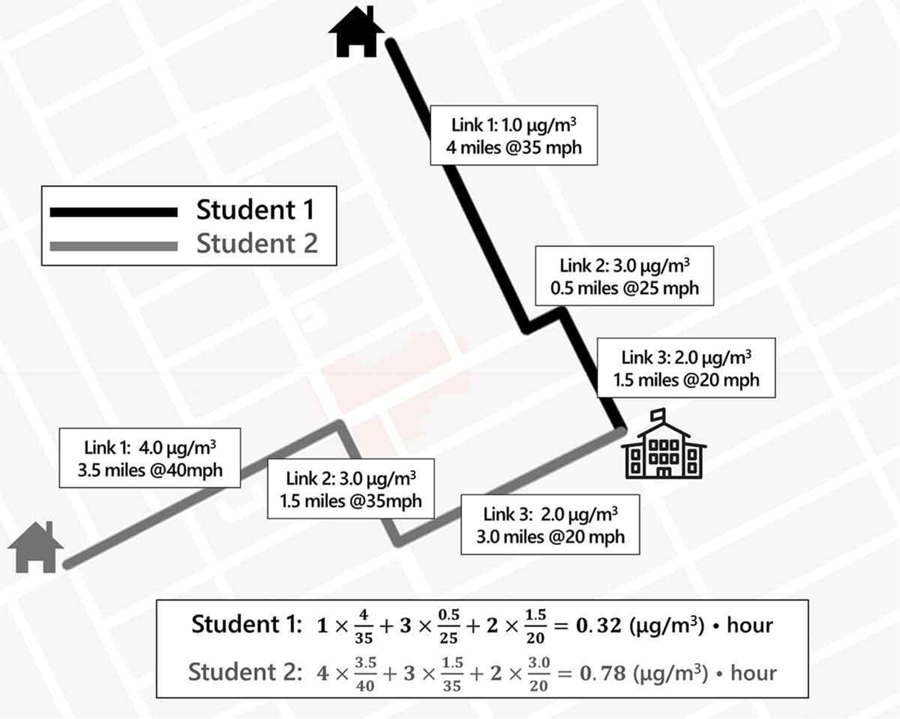
Figure 1.
Illustration of exposure estimation along routes for AM and PM commutes. Average pollution concentrations along each link, accounting for time of day, are weighted by the time spent traveling on each link (which is calculated using distance of each link and velocity pertaining to the relevant mode)

