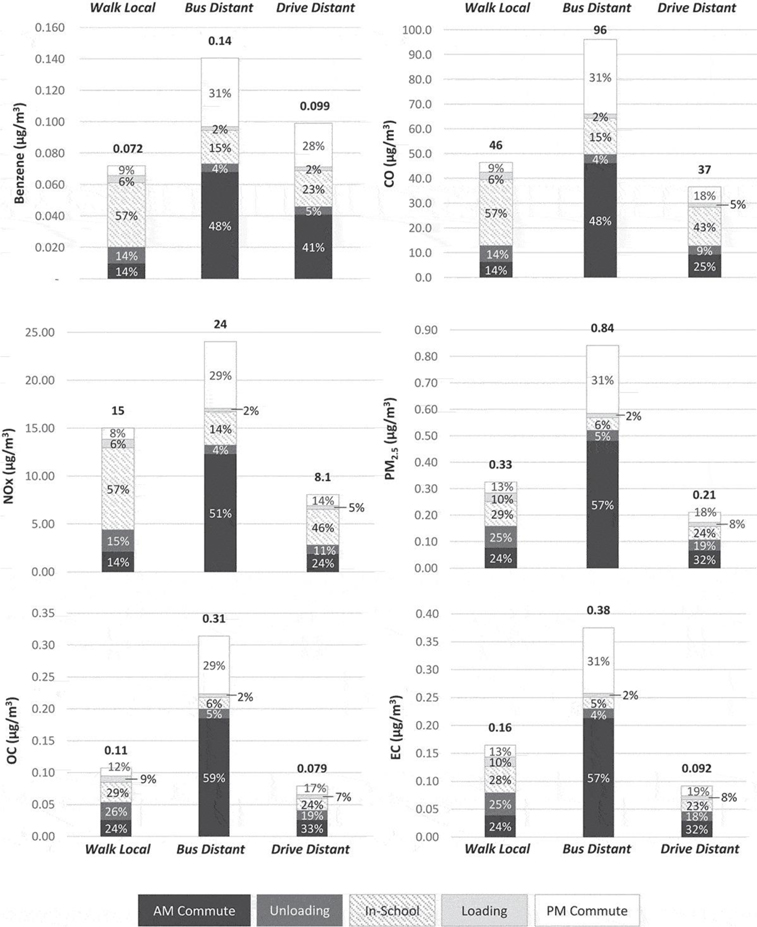
Figure 2.
Relative contributions of each microenvironment to average school day exposure, by school attendance scenario.Average time-weighted daily exposure by pollutant is totaled on top of each stacked bar. The relative contributions of each microenvironment are displayed as percentages within the stacked bars

