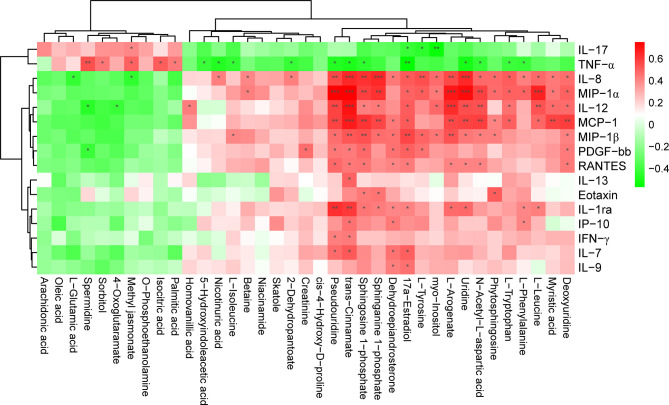
Figure 6.
Significant correlation between the level of cytokines, chemokines, and DAMs in patients with MS. The heatmap was plotted using Pearson’s correlation analysis. The correlation coefficient is denoted by red and blue, representing positive and negative correlations, respectively. Asterisks indicate significant positive or negative correlations. P value was corrected using Benjamini-Hochberg procedure. *Padj < 0.05; **Padj < 0.01; ***Padj < 0.001.

