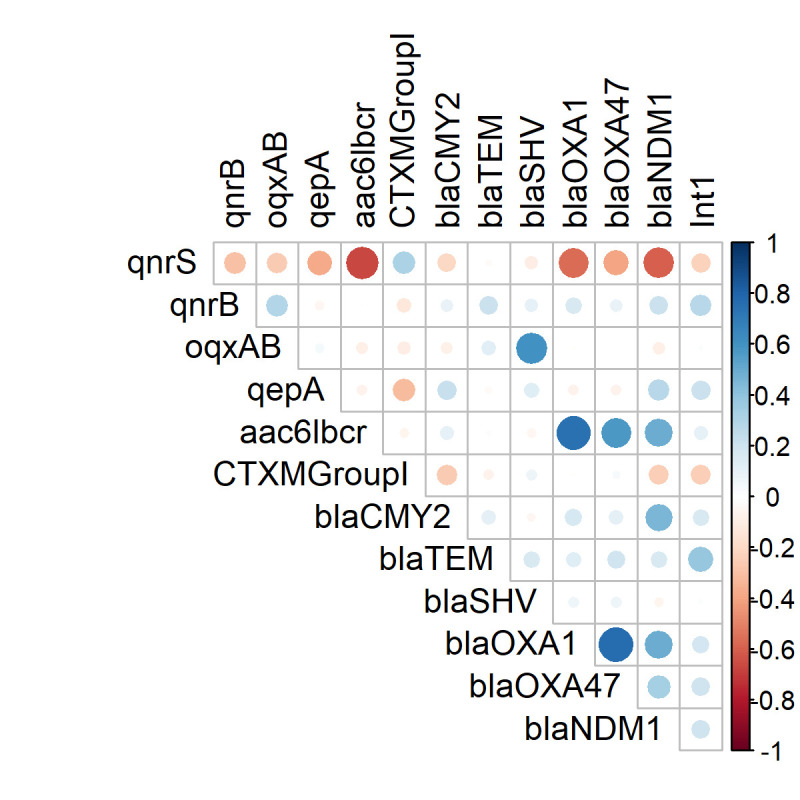
Fig 1. Correlation matrix of the presence of PMQR genes with ESBL and carbapenemase and integron (int1) encoding genes in E. coli.

White spaces are not significantly correlated. Blue circles indicated significant positive correlation and red showed significant negative correlation. The size and strength of colour represent the numerical value of the Phi correlation coefficient.
