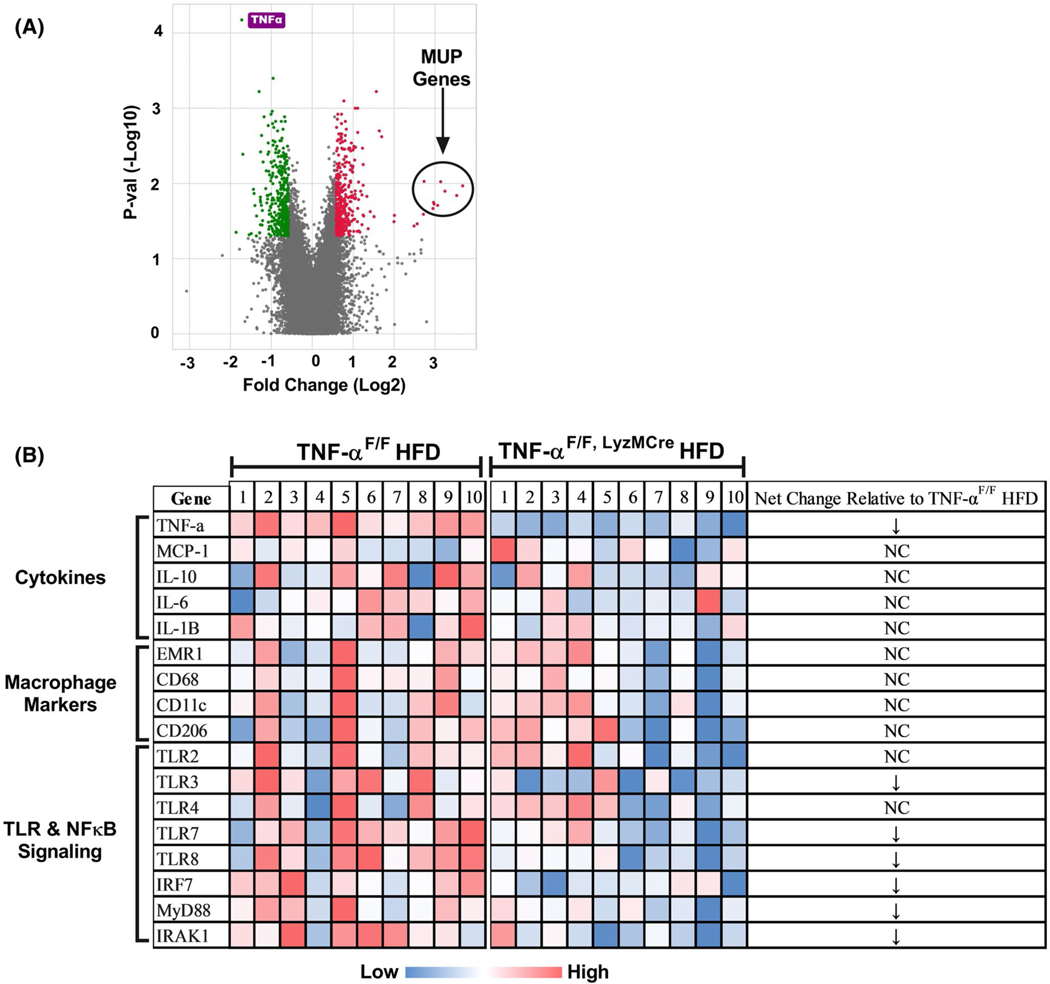
FIGURE 3.
Microarray data from adipose tissue of TNF-αF/F and TNF-αF/F,LyzMCre HFD-fed mice. A, Volcano: a total of 145 genes were ±1.5x changed in epididymal adipose tissue of TNF-αF/F,LyzMCre HFD vs TNF-αF/F HFD mice (n = 10/group) (P < .05). The green and red colors signify genes that were −1.5x and +1.5x downregulated and upregulated, respectively, in the TNF-αF/F,LyzMCre HFD vs TNF-αF/F HFD mice (P < .05). TNF-α (labeled in purple) was found to be the most statistically significant down-regulated gene as a result of macrophage TNF-α deletion (P < .05). Major urinary proteins (MUPs) were found to be highly up-regulated (>15x) macrophage TNF-α deficient mice (P < .05). B, Clustering of gene expression profiles for each genotype

