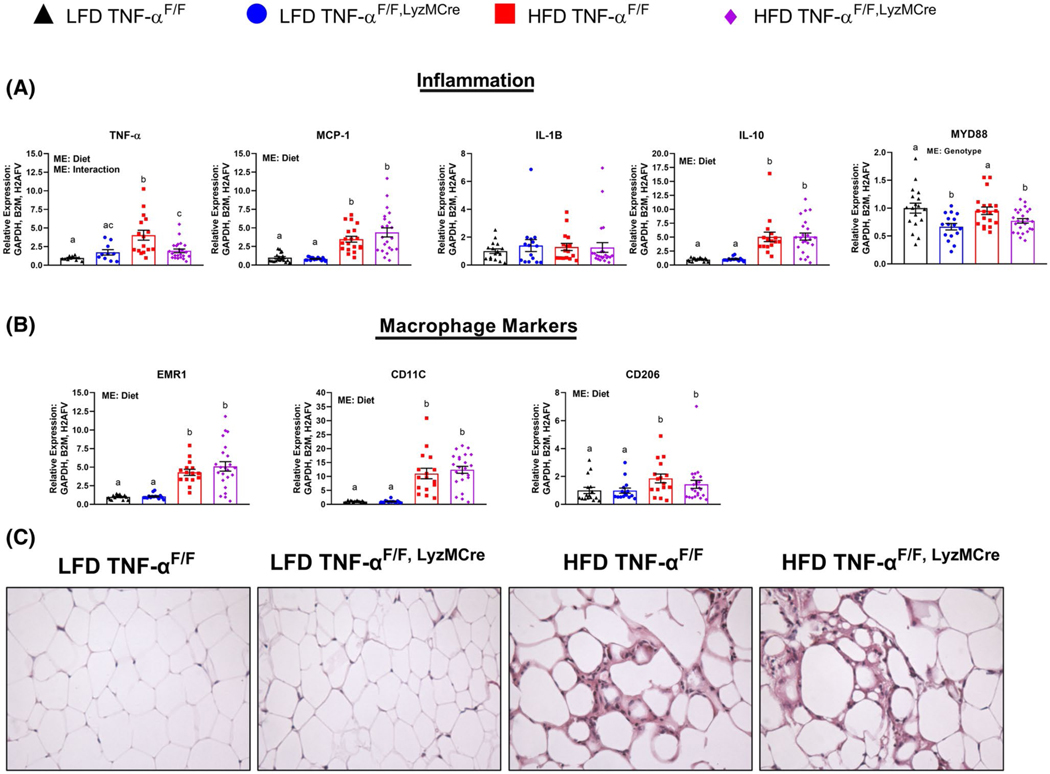
FIGURE 4.
Adipose tissue inflammation. A, TNF-α, MCP-1, IL-1β, IL-10, and MYD88, B, EMR1, CD11c, and CD206 (n = 16–28/group), C, representative epididymal adipose tissue H&E images taken at 40x. Data are presented as mean ±SE. Bar graphs not sharing a common letter are significantly different from one another (P < .05). NC = No change

