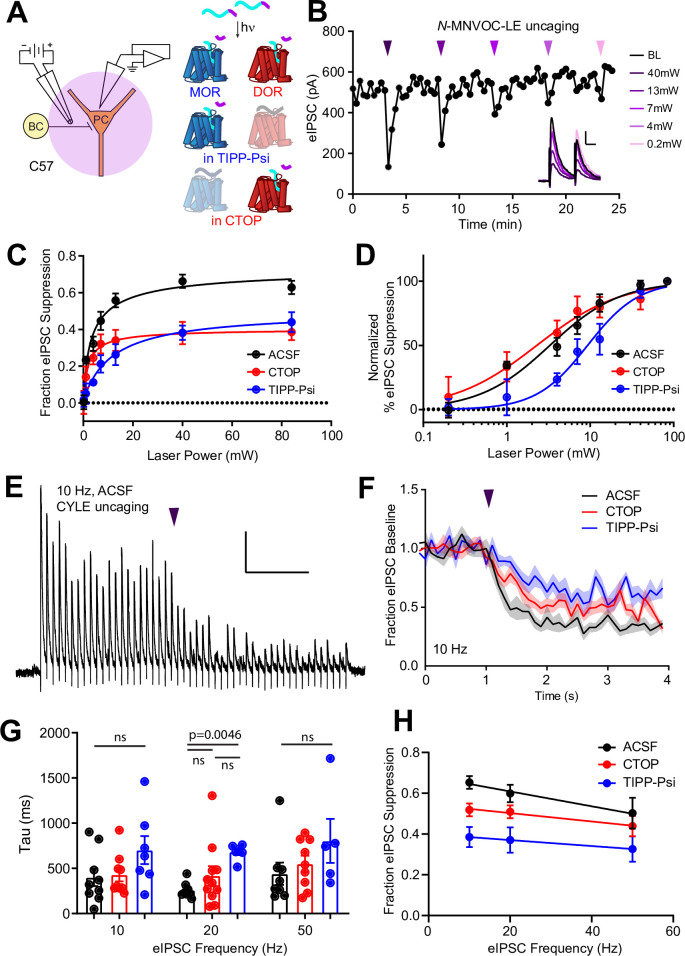
Figure 2. Characterization of the potency and kinetics of synaptic modulation by [Leu5]-enkephalin (LE) at mu (MOR) and delta opioid receptors (DOR) using caged peptides.
(A) Left: Schematic of the experimental configuration for photo-uncaging of opioid neuropeptides while recording electrically evoked inhibitory synaptic transmission in wild-type mice. Right: Schematic of photoreleasing LE (cyan) from N-MNVOC-LE or CYLE (cyan with purple caging group) in the presence of selective antagonists to isolate its action on either MOR (blue, in TIPP-Psi) or DOR (red, in CTOP). (B) Example recording showing graded suppression of inhibitory synaptic transmission by uncaging N-MNVOC-LE at various light intensities. Inset: Example electrically evoked IPSC (eIPSCs) before (black) and after LE uncaging at each light intensity. Scale bars: x = 20 ms, y = 100 pA. (C) Linear optical power-response curves of eIPSC suppression as a function of light intensity, in the absence (black, n = 6–12 cells per laser intensity) and presence of either CTOP (red, n = 5–8 cells) or TIPP-Psi (blue, n = 4–10 cells). (D) Logarithmic optical power-response curves of the data in (C) normalized to the maximal eIPSC suppression observed in each condition. (E) Representative recording from a pyramidal cell demonstrating rapid suppression of eIPSC amplitude in response to photoactivation of CYLE during 10 Hz trains of electrical stimuli. Purple arrow represents CYLE uncaging at 2 s into the 10 Hz train. Outward stimulus artifacts are removed for clarity. Scale bars: x = 1 s, y = 100 pA. (F) Average, baseline subtracted and baseline-normalized eIPSC amplitude showing the kinetics of synaptic suppression with electrical stimulation at 10 Hz in the absence (artificial cerebrospinal fluid [ACSF], n = 9 cells from six mice) and presence of either CTOP (n = 12 cells from seven mice) or TIPP-Psi (n = 8 cells from six mice). (G) Time constants of synaptic suppression in response to CYLE photoactivation with an 84 mW light flash at the indicated frequencies of synaptic stimulation. At 20 Hz, the time constant in TIPP-Psi was significantly greater than the time constant without any antagonists. (H) Plot of eIPSC suppression as a function of synaptic stimulation frequency.

