. 2021 Nov 1;10:e72132. doi: 10.7554/eLife.72132

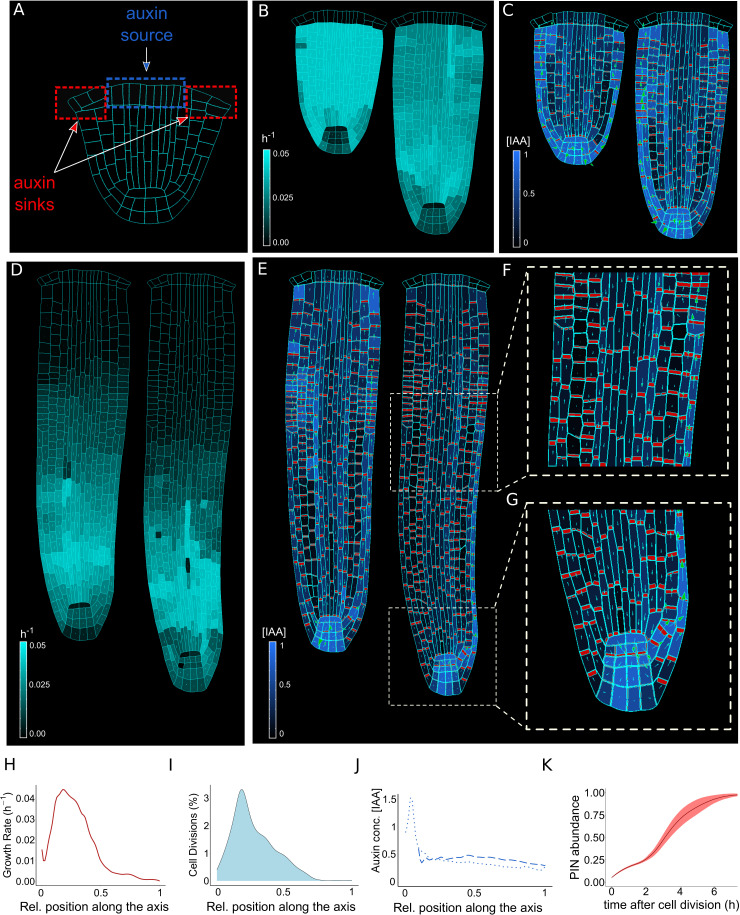
Figure 2. The model reproduces realistic root meristem geometry, auxin distribution, and PINs polar localizations using auxin flux scenario.

(A) Initial embryonic set point. Locations of auxin influx (auxin source, blue) and evacuation (auxin sinks, red) from the embryo are shown. (B, D) Model simulations predict a time evolution of cell growth rates (bright cyan color) and principal growth directions (white lines). Ongoing cell division events are marked by black regions. (C, E) Dynamics of auxin distribution (blue color), auxin flow direction (arrows,) and PIN localizations (red). (F, G) Zoom on basal meristem (F) and root apical meristem (G). The model correctly reproduces very detailed PINs localizations including bipolar PIN2 localization in the cortex (F). (H–J) Profiles of average values of interest across all cell files along the longitudinal axis. (H) Growth rate profile along the root axis. The fastest-growing region is located in the apical meristem as observed experimentally (Bassel et al., 2014). (I) Cell division frequencies along the root axis. The majority of cell divisions occur in the apical meristem. (J) Auxin concentration in the vascular tissues (dashed blue line) and auxin concentration in the non-vascular tissues (external tissues and the root tip, dotted blue line) along the root axis. Most of the auxin is concentrated in the root tip as observed in experiments (Overvoorde et al., 2010). Time-lapse profile of PINs re-localization on the membranes after cell division event. PINs re-localization is completed in approximately 5–6 hr after cell division (Glanc et al., 2018). All simulations have been run until 1500 time steps were reached.

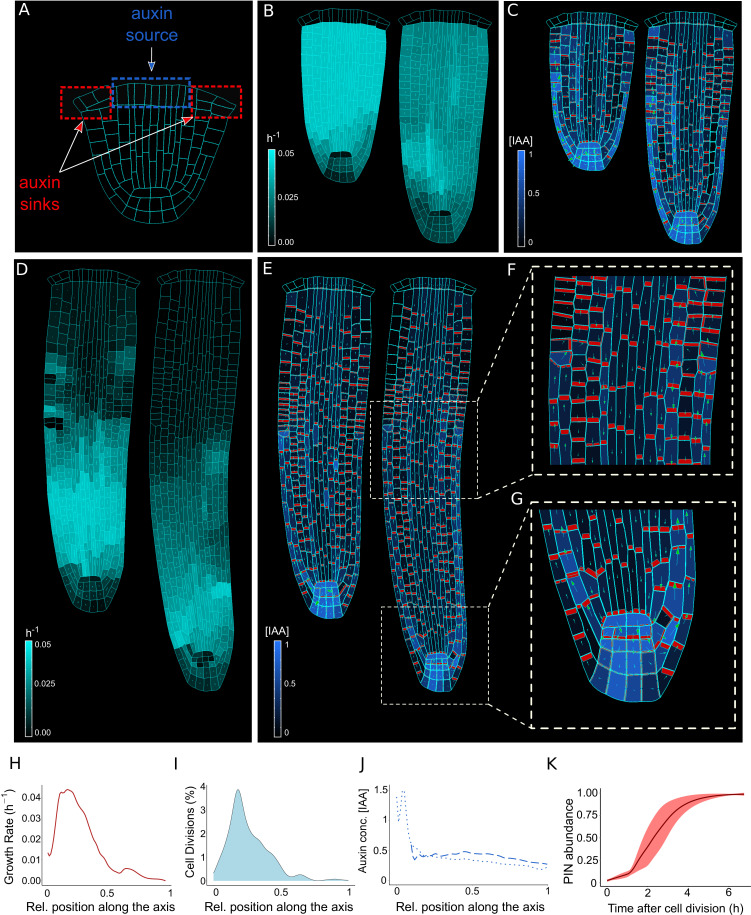
Figure 2—source data 1. Source data used to generate Figure 2H-K.

Figure 2.

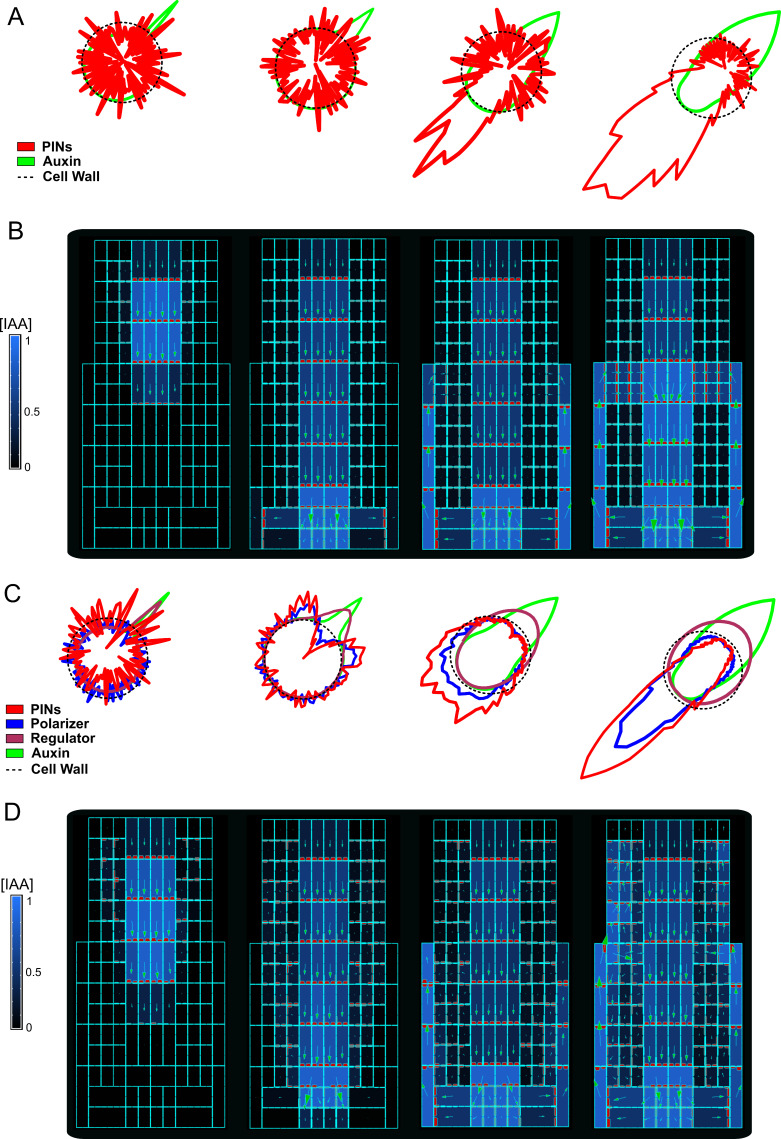
Figure 2—figure supplement 1. Comparison between ‘auxin-flux’ and ‘regulator-polarizer’ models for PIN polarization.

Figure 2—figure supplement 1.

(A) Single-cell model simulation of the ‘auxin-flux’ model. In this simple single-cell model, there are only two species of molecules: auxin (light green line) and PINs (red line). The auxin-flux model follows a simple rule: auxin application on one side of the cell wall (dotted line) induces PINs polarization on the other side of the cell. (B) Model simulation using the ‘auxin-flux’ model (A) on a simplified root-like grid structure. The ‘auxin-flux’ method is capable of producing a realistic auxin flow inside the grid. Auxin was initially applied to the central cells of the top layer of the grid. (C) Single-cell model simulation of the ‘regulator-polarizer’ method. This model represents a molecular expansion of the ‘auxin-flux’ model (A). This model includes four molecular species: auxin (light green line), PINs (red line), a regulator (dark green line), and a polarizer (blue line). Auxin application on one side of the cell wall (dotted line) induces recruitment of regulators proteins which inhibits the PIN polarizer pushing it towards the opposite side of the cell surface. The polarizer in turn fosters the recruitment of PINs molecules on that side of the cell. (D) Model simulation with the ‘regulator-polarizer’ method (C) on a simplified root-like grid structure. The ‘regulator-polarizer’ model was capable of producing an auxin flow inside the root. Auxin was initially applied to the central cells of the top layer of the grid.
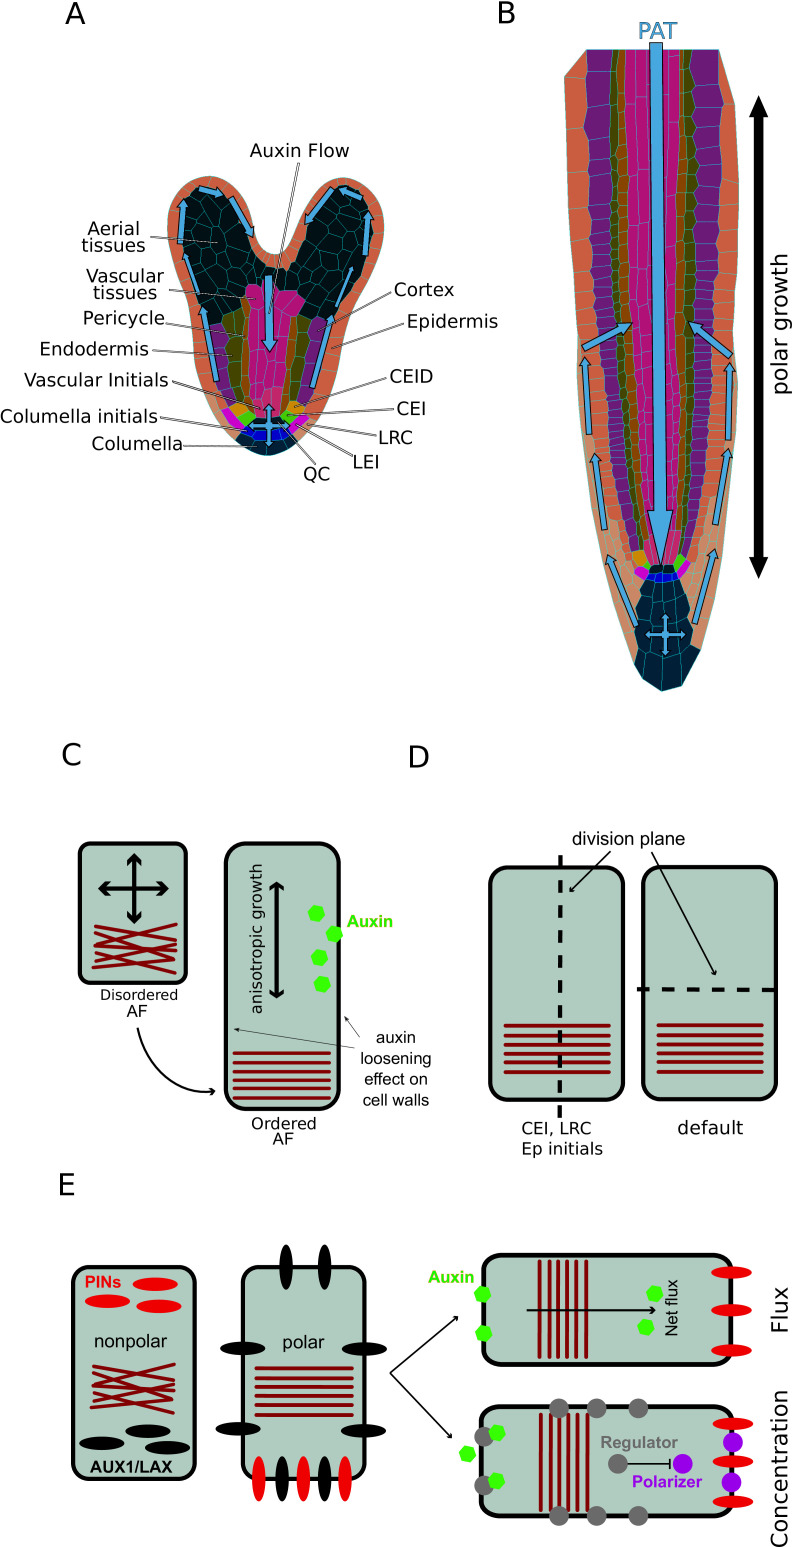
Figure 2—figure supplement 2. Model schematics.

Figure 2—figure supplement 2.

(A) Digitized microscopy image of an A. thaliana heart-stage embryo processed through MorphoGraphX (Barbier de Reuille et al., 2015). Cell types are shown with different colors, while predicted auxin flow direction is depicted with the arrow. (B) Schematics of a mature A. thaliana root. The direction of auxin transport is visualized with blue arrows. Growth anisotropy is depicted with a bidirectional black arrow. (C) Cells are under constant internal turgor pressure. Auxin induces cell walls relaxation and allows cell expansion. Mechanical deformation(strain) imposed on root cell walls forces the reorganization of the anisotropy factor (AF), which in turn maintains the anisotropic growth. (D) Cell division occurs according to the cell polarity defined by the AF vector. Cell division plane is orthogonal to cell polarity; exceptions to this rule are cortex/endodermis and LRC/epidermis initials. (E) PINs localization is defined by AF orientation and auxin flux direction. Auxin feedback on PINs localization is determined by two equivalent mechanisms; the total auxin flux through the plasma membrane (the ‘auxin-flux’ model) or inhibition of PIN polarizer (e.g. kinase) through an auxin-driven regulator (e.g. phosphatase) (the ‘regulator-polarizer’ model).
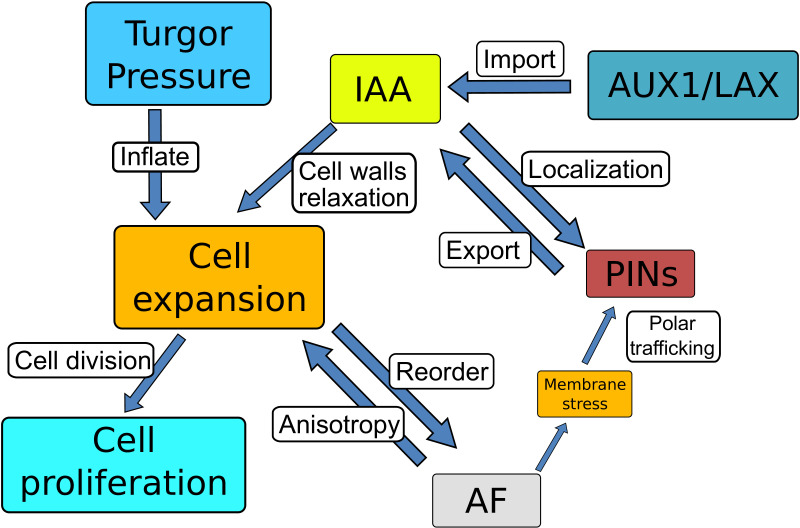
Figure 2—figure supplement 3. Schematic diagram of the root model.

Figure 2—figure supplement 3.

The diagram shows the main components of the current model and their connections: The turgor pressure forces isotropic cell expansion driven by cell wall relaxation induced by intracellular auxin. Cell expansion causes mechanical deformation of the cell walls that triggers anisotropy factor (AF) reorganization. AF restricts cell expansion along the axis, producing anisotropic growth. Cells divide once the cell area has reached a specific threshold. AF alignment maintains PIN polarity (i.e. by causing the membrane bending stress), reinforcing the auxin-dependent PINs polarization. Polar PINs efflux carriers and non-polar AUX/LAX influx carriers mediate the auxin distribution along the root.
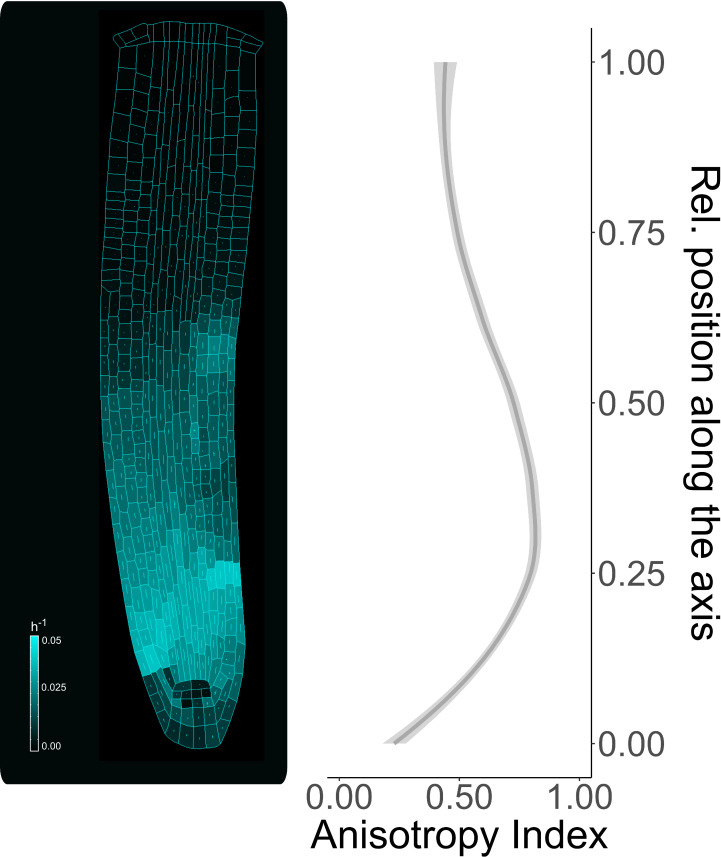
Figure 2—figure supplement 4. Anisotropy index measured along the proximo-distal axis.

Figure 2—figure supplement 4.

Individual cells growth rate during model simulation (left figure) and anisotropy index along the root axis (right plot). The anisotropy index has been calculated as the ratio of growth directions. A high anisotropy index indicates a greater tendency of the cell for the anisotropic growth, in contrast to a lower index which denotes a cell tendency toward isotropic growth. The simulation has been run for 1500 time steps.
Figure 2—figure supplement 4—source data 1. Source data used to generate Figure 2—figure supplement 4.
Figure 2—figure supplement 5. The model can reproduce realistic root meristem geometry, auxin distribution, and PINs localization using the ‘regulator-polarizer’ model scheme.

Figure 2—figure supplement 5.

(A) Initial embryonic set point. Locations of auxin influx (auxin source, blue) and evacuation (auxin sinks, red) from the embryo are shown. (B, D) Model simulations predict a time evolution of cell growth rates (bright cyan color) and principal growth directions (white lines). Ongoing cell division events are marked by black regions. (C, E) Dynamics of auxin distribution (blue color), auxin flow direction (arrows), and PIN localization (red). (F, G) Zoom on basal meristem (F) and apical meristem (G) of the root. The model correctly reproduces very detailed PINs localizations including bipolar PIN2 localization in the cortex (F). (H–J) Profiles of average values of interest across all cell files along the longitudinal axis. (H) Growth rate profile along the root axis. The fastest-growing region is located in the apical meristem as observed experimentally (Bassel et al., 2014). (I) Cell division frequencies along the root axis. The majority of cell divisions occur in the apical meristem. (J) Auxin concentration in the vascular tissues (dashed blue line) and auxin concentration in the non-vascular tissues (external tissues and the root tip, dotted blue line) along the root axis are shown. Most of the auxin is concentrated in the root tip as observed in experiments (Overvoorde et al., 2010). Time-lapse profile of PINs re-localization on the membranes after cell division event. PINs re-localization is completed in approximately 5–6 hr after cell division (Glanc et al., 2018). The full simulation has been run for 1500 time steps.
Figure 2—figure supplement 5—source data 1. Source data used to generate Figure 2—figure supplement 5H-K.
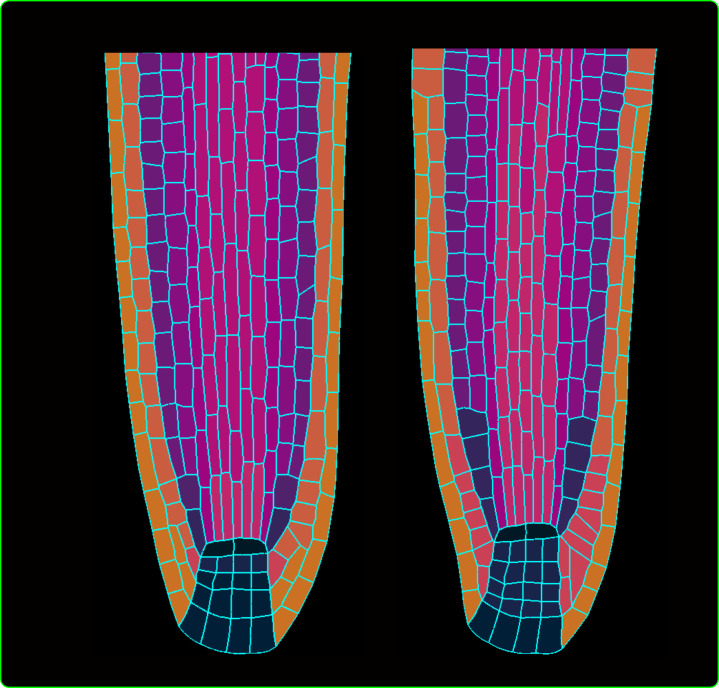
Figure 2—figure supplement 6. Cell division rule testing.

Figure 2—figure supplement 6.

The wild-type simulation (left) versus root simulations where specific rules for the stem cell niche are removed from the model (right).
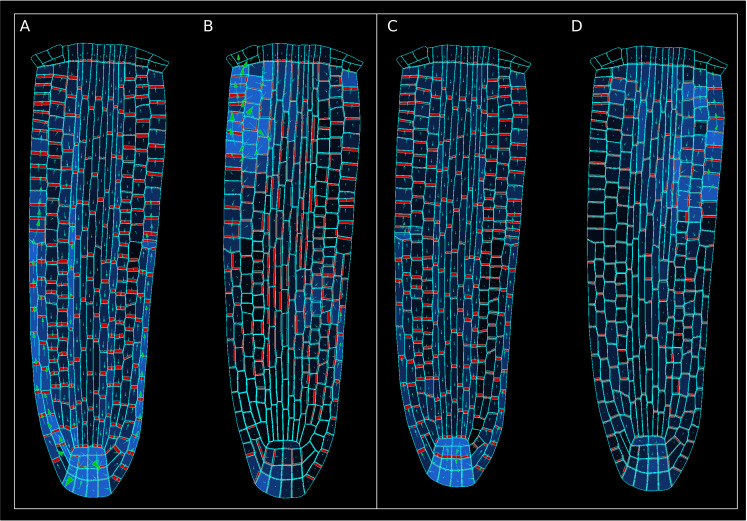
Figure 2—figure supplement 7. Comparison between the reference model with an alternative model simulation in which the contribution of the anisotropy factor (AF) to PIN localization is omitted at the start the of simulation, using the ‘auxin-flux’ (A–B) and the ‘regulator-polarizer’ (C–D) models, respectively.

Figure 2—figure supplement 7.

In these simulations (B–D) the auxin maximum does not form due to disrupted PIN subcellular localizations.
Figure 2—video 1. Model simulations obtained with the auxin-flux model, related to Figure 2.
Download video file (39MB, mp4)
The upper simulation displays auxin distribution (blue color), auxin flow direction (arrows), and PIN localizations (red). The lower simulation displays cell growth rate (bright cyan color) and principal growth directions (white lines).
Figure 2—video 2. Model simulations obtained with the regulator-polarizer model, related to Figure 2—figure supplement 5.
Download video file (33.8MB, mp4)
The upper simulation displays auxin distribution (blue color), auxin flow direction (arrows), and PIN localization (red). The lower simulation displays cell growth rate (bright cyan color) and principal growth directions (white lines).