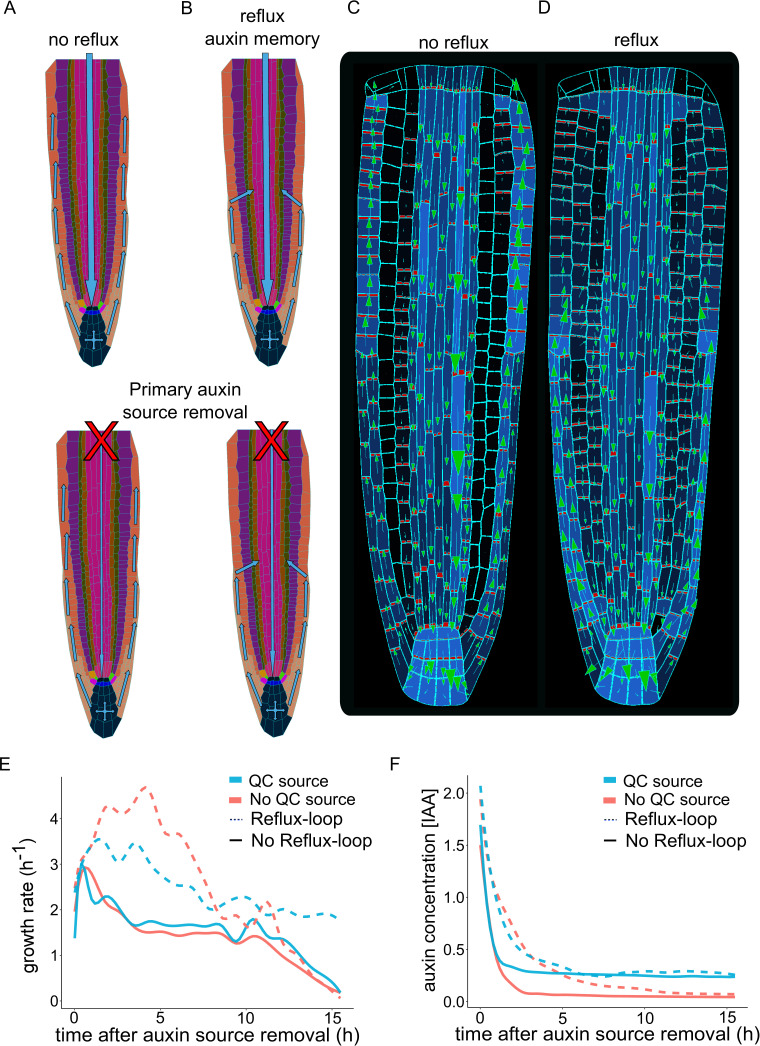
Figure 3. Independent root growth requires auxin reflux and local auxin production.
(A–D) Schematics (A and B) and model simulations (C and D) with the disabled auxin reflux-loop (A, C) or wild-type-like scenario with self-emerging reflux (B, D). Only the in reflux scenario auxin moves from the epidermis back into the vascular tissues sustaining the long-term root growth. (E) Growth rate profiles of model simulations after primary auxin source removal, in four different scenarios. The plot shows the total root growth rate over time. In the absence of an auxin reflux-loop, the root is unable to sustain growth for a long period (solid lines) even if a secondary auxin source in the root tip was introduced (solid blue line). On the contrary, the presence of an auxin reflux-loop sustains the root growth for prolonged periods (dotted lines), further augmented by the presence of a secondary auxin source in the root tip (dotted blue line). (F) Auxin concentration profiles of model simulations after primary auxin source removal. The plots show the average radial auxin concentration among the root cells. In the absence of an auxin reflux-loop, the average auxin concentration in the root quickly drops to zero (solid red line). Alternatively, the presence of an auxin reflux-loop allows the root to maintain an auxin reserve for prolonged periods (dotted blue line). The presence of a secondary auxin source in the root tip preserves an auxin reservoir and sustains root growth in the long term (blue lines). The model simulations have been run for 1000 time steps.

