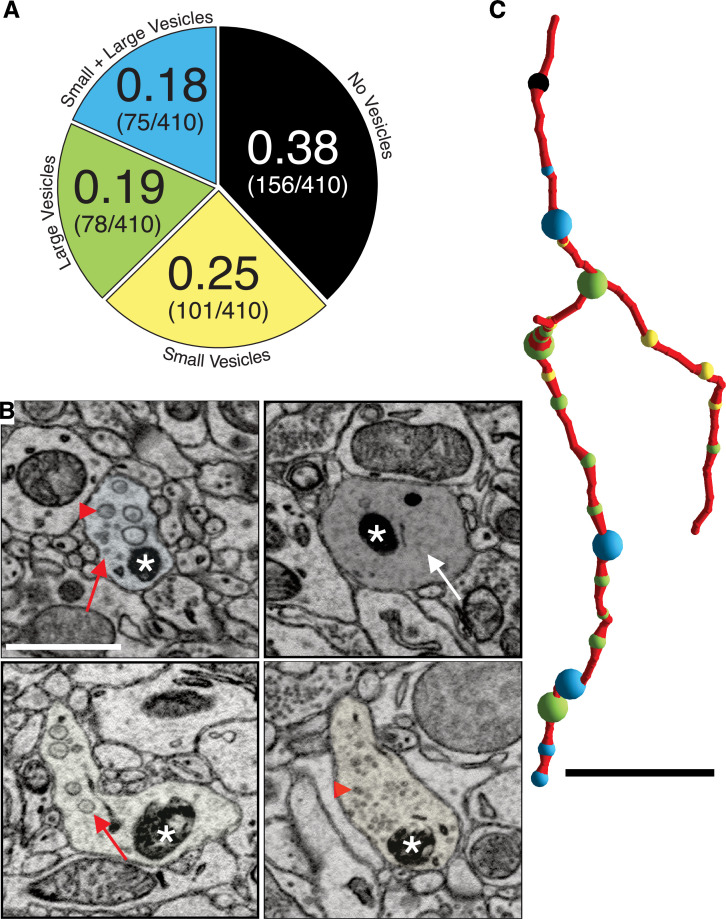
Figure 2. Dopaminergic (DA) axon varicosities are either empty or filled with different sized vesicles.
(A) Pie chart showing ratio of each kind of DA varicosity across a population of DA axons (n = 409 varicosities scored across 75 axons, 1 mouse). (B) Single 2D images showing representative examples of each kind of DA axon varicosity with color overlay corresponding to each type (refer to pie chart in A). Red arrowheads point to small vesicles, red arrows point to large vesicles, and the white arrow points to an empty varicosity. Asterisks marks Apex2+ mitochondria. (C) Reconstruction of a single Mito-Apex2 DA axon with each class of varicosity marked as a differently colored spheres: black = no vesicles, yellow = small vesicles, green = large vesicles, and blue = small and large vesicle-filled varicosity. Spheres are scaled to the size of the bouton. Scale bar (B) = 1 µm, (C) = 10 µm.

