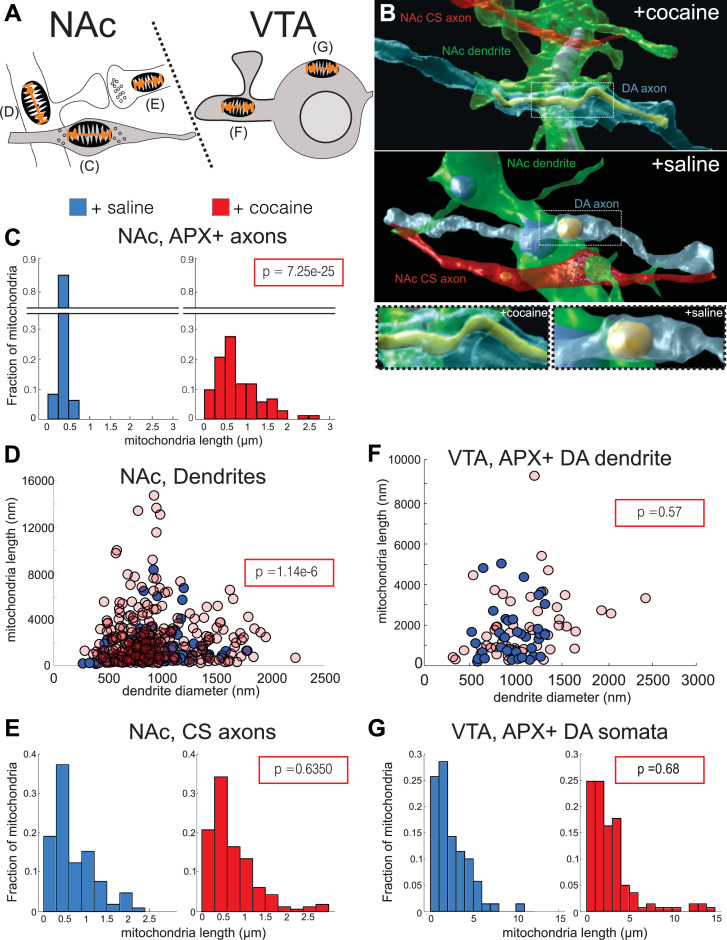
Figure 9. Cocaine results in increased mitochondrial length in dopaminergic (DA) axons and medium spiny neuron (MSN) dendrites.
(A) Cartoon depicting neurons where mitochondrial length was measured. Left: in the nucleus accumbens (NAc), we measured mitochondria in: (C) Apex2+ DA axons, (D) MSN dendrites, and (E) excitatory axons making chemical synapses (chemical synapse [CS] axons). Right: in the ventral tegmental area (VTA), we measured mitochondria in: (F) Apex2+ DA dendrites, and (G) Apex2+ DA soma. (B) 3D reconstructions from cocaine- (top) and saline- (bottom) treated mice of a DA axon (blue), afferent CS axon (red), and MSN dendrite (green) from the NAc. Shown is just the mitochondria reconstructed within the DA axon. Bottom images show zoomed views centered on the DA axon mitochondria from cocaine- (left) and saline- (right) treated mice. (C) Histograms of mitochondrial length in NAc, Apex2+ (‘APX+’) DA axons +saline: 0.36 ± 0.01 μm, n = 162 mitochondria across 42 axons, 2 mice; +cocaine: 0.79 ± 0.05 μm, n = 162 mitochondria across 35 axons, two mice. p = 7.25e-25. (D) Scatter plot of mitochondrial lengths versus dendrite diameter of NAc MSN dendrites (+saline: 1.39 ± 0.12 mitochondrial length (nm)/dendrite diameter (nm), n = 132 mitochondria across 50 dendrites, two mice; +cocaine: 3.0 ± 0.2 μm mitochondrial length (nm)/dendrite diameter (nm), n = 260 mitochondria across 41 dendrites, two mice. p = 1.14e-6). (E) Histogram of mitochondrial lengths in NAc CS axons (+saline: 0.70 ± 0.05 μm, n = 104 mitochondria across 30 axons, two mice; +cocaine: 0.73 ± 0.04 μm, n = 164 mitochondria across 57 axons, two mice. p = 0.64). (F) Scatter plot of mitochondrial lengths versus dendrite diameter of VTA Apex2+ DA dendrites + saline: 1.74 ± 0.25 mitochondrial length (nm)/dendrite diameter (nm), n = 37 mitochondria across four dendrites, one mouse; +cocaine: 1.85 ± 0.22 mitochondrial length (nm)/dendrite diameter (nm), n = 53 mitochondria across 10 dendrites, one mouse. p = 0.57. (G) Histogram of mitochondrial length in Apex2+ DA Soma (+saline: 2.46 ± 0.24 μm, n = 70 mitochondria across four soma, one mouse; +cocaine: 2.78 ± 0.23 μm, n = 141 mitochondria across five soma, one mouse. p = 0.68). Blue histograms and data points on scatter plots = +saline-treated mice, and red histograms and data points = +cocaine-treated mice. Data: mean ± SEM. p-Value: two-tailed Mann-Whitney U test.


