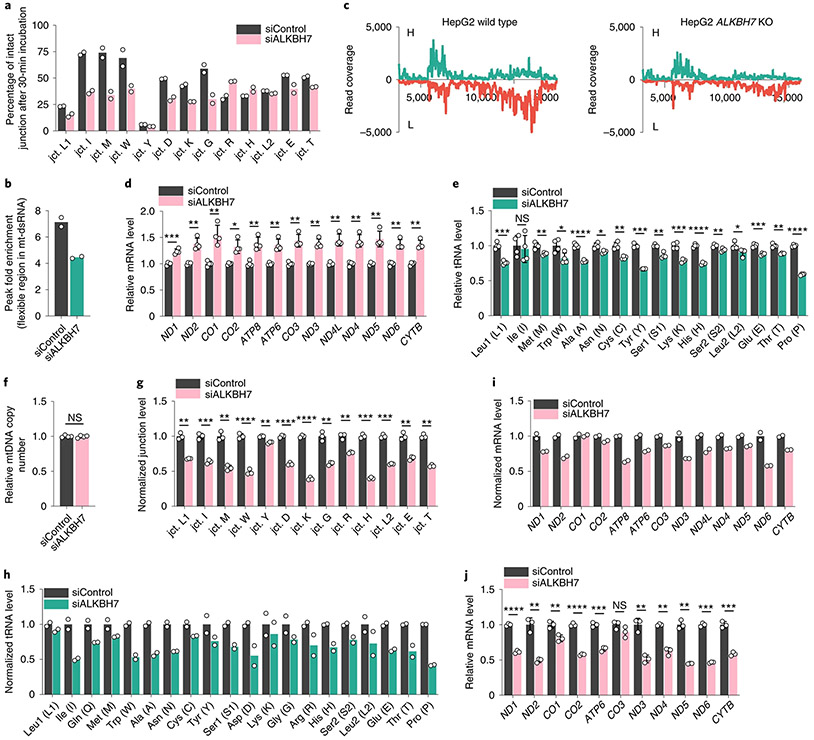
Fig. 3 ∣. ALKBH7-mediated m22G demethylation affects polycistronic mt-RNA processing and alters steady-state mt-RNA levels.
a, In vitro assay to monitor tRNA/mRNA junction site processing. The percentage of intact junction site after incubation for 30 min is shown. b, Fold enrichment calculated from the enriched mt-dsRNA flexible region (icSHAPE peak region) in siALKBH7 HepG2 cells versus siControl. c, DAMM-seq read coverage of IP-enriched dsRNA across the mitochondrial genome (protein-coding region, −3.5–16 kb). The H and L strands are shown in green and red, respectively (both normalized to 18S rRNA). d, Relative mRNA levels of 13 mt-mRNAs (normalized to ACTB) in ALKBH7-depleted HepG2 cells versus the control. P = 0.0006, 0.0053, 0.0088, 0.0139, 0.0046, 0.0069, 0.0035, 0.0027, 0.003, 0.0031, 0.0074, 0.0016 and 0.0014, respectively; unpaired, two-tailed t-test. e, Relative levels of 16 mt-tRNAs (normalized to U6 small nuclear RNA (snRNA)) in ALKBH7-depleted HepG2 cells versus the control. P = 0.0003, 0.7187, 0.0069, 0.0235, <0.0001, 0.0109, 0.003, 0.0001, 0.0028, 0.0005, <0.0001, 0.0085, 0.0356, 0.0004, 0.002 and <0.0001, respectively; unpaired, two-tailed t-test. f, Relative level of mtDNA (normalized to gDNA) in siALKBH7 versus siControl. P value = 0.7822; unpaired, two-tailed t-test. g, Normalized tRNA/mRNA junction levels in 10-min EU-labelled nascent mt-RNA extracted from siALKBH7 HepG2 cells versus siControl. P = 0.006, 0.0005, 0.0011, <0.0001, 0.0014, <0.0001, <0.0001, 0.0049, 0.0064, 0.0001, 0.0005, 0.0022 and 0.002, respectively; unpaired, two-tailed t-test. h, Normalized DAMM-seq read coverage of nascent mt-tRNA in 10-min EU-labelled mt-RNA extracted from siALKBH7 HepG2 cells versus siControl. i, Normalized DAMM-seq read coverage of nascent mt-mRNA in 10-min EU-labelled mt-RNA extracted from siALKBH7 HepG2 cells versus siControl. j, Relative mt-mRNA levels in 10-min EU-labelled nascent mt-RNA extracted from siALKBH7 HepG2 cells versus siControl. P = <0.0001, 0.0076, 0.0081, <0.0001, 0.0002, 0.136, 0.0032, 0.0041, 0.0039, 0.0001 and 0.0006, respectively; unpaired, two-tailed t-test. For a,b,h,i, n = 2 biologically independent samples. For d–f, n = 4 biologically independent samples; data are presented as mean values ± s.d. For g,j, n = 3 biologically independent samples; data are presented as mean values ± s.d. For d–g and j, NS, P ≥ 0.05; *P < 0.05; **P < 0.01; ***P < 0.001; and ****P < 0.0001.

