
Figure 2. LC11 is causally involved in object-induced slowing.
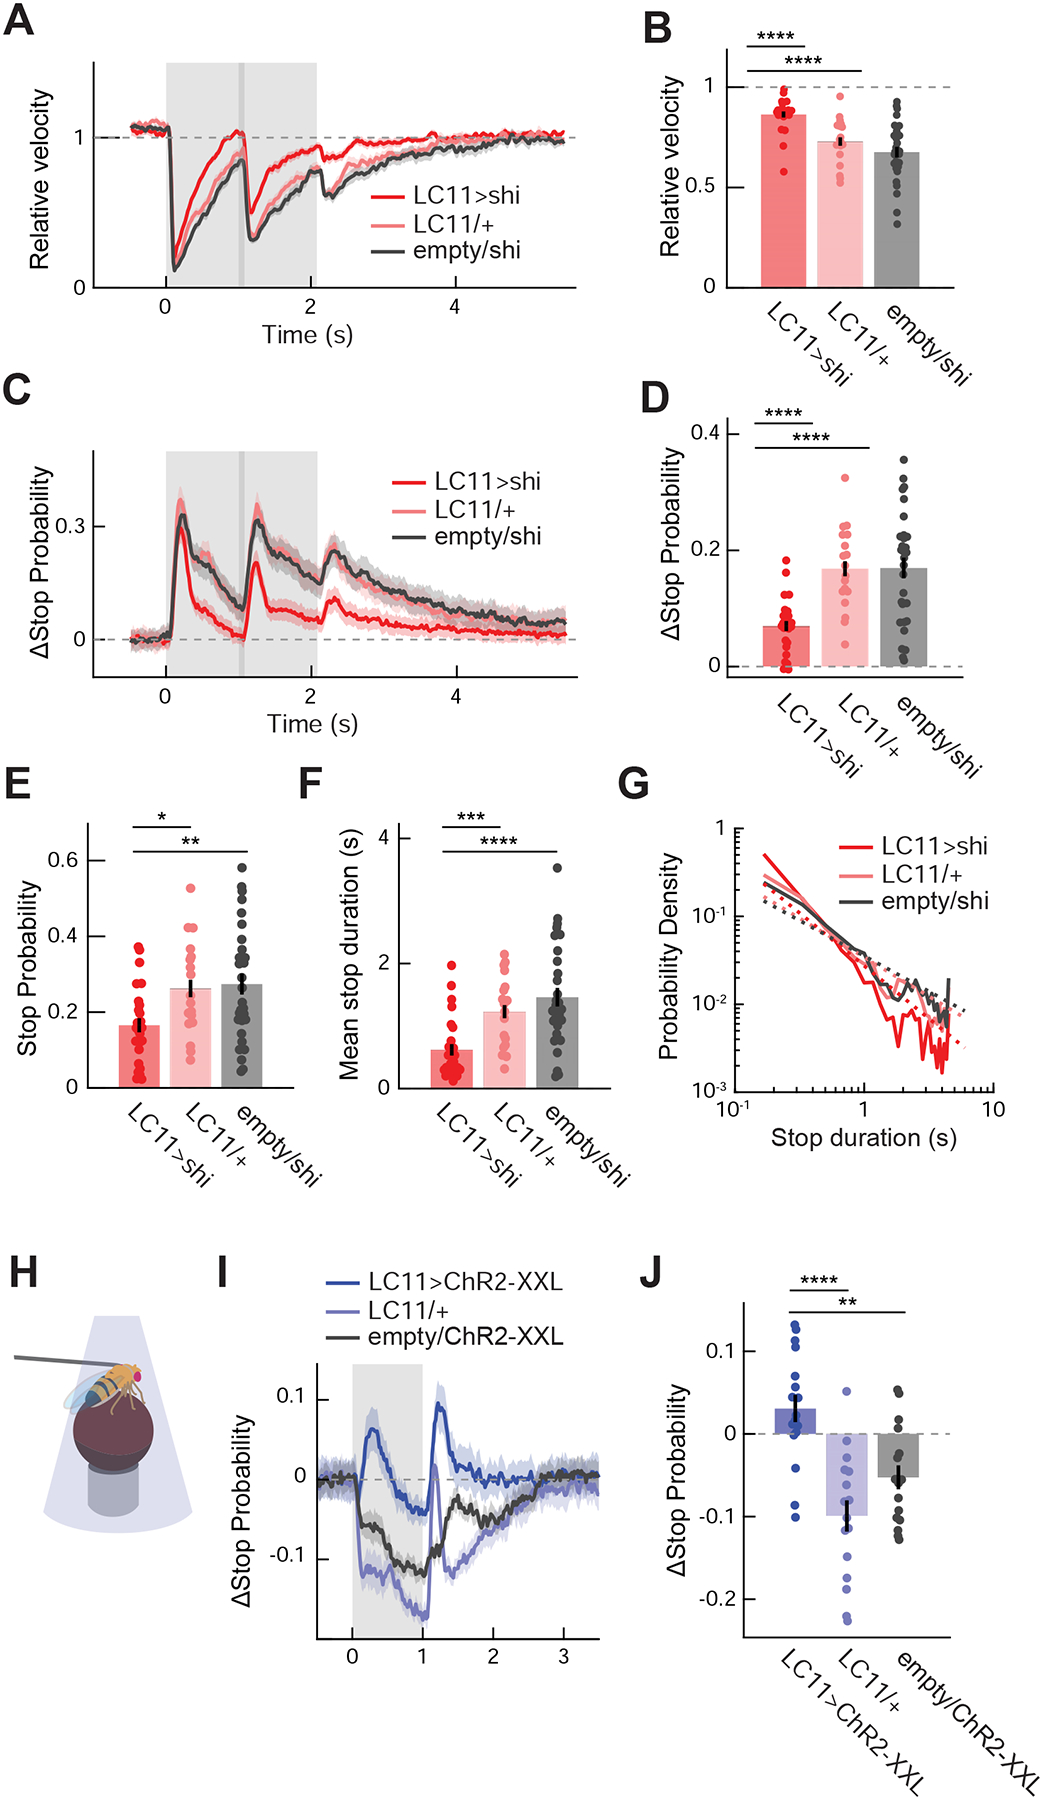
(A) Average relative walking speed of LC11-silenced flies in response to presentation of small squares, with corresponding Gal4 and UAS controls. The gray shaded region indicates the period during which stimuli were presented, and the area with a darker shade indicates when the stimuli were moving. (B) Relative walking speed of LC11-silenced and control flies, averaged over 4 seconds after the stimulus onset. (C) Change in instantaneous stop probability in LC11-silenced and control flies in response to presentation of small squares. (D) Time-averaged change in instantaneous stop probability in LC11-silenced and control flies. (E) Baseline stop probability during the pre-stimulus period by genotypes. (F) Mean duration of stop triggered by the movement of squares in LC11-silenced and control flies. (G) Log-log histogram of the duration of stop triggered by the motion of small squares by genotypes. Dotted lines are the across-fly average of the linear functions fit to individual log-log histograms (See Figure S1F). (H) A schematic of optogenetic activation experiment. (I) Average change in stop probability of flies expressing ChR2-XXL in LC11 and control flies. The gray shaded region indicates the period during which blue lights from the DLP projectors were applied to the fly. (J) Change in stop probability in response to optogenetic activation of LC11 in flies expressing ChR2-XXL and control flies, averaged over one second during the stimulation. (A – G) n = 25 flies (LC11/shi), 18 (LC11/+), 30 (empty/shi) (flies). (I, J) n = 17 flies (LC11>ChR2-XXL), 16 (LC11/+), 16 (empty/ChR2-XXL). * p<0.05; ** p<0.01; *** p < 0.001; **** p<0.0001 in Wilcoxon rank-sum test. See also Figure S2.