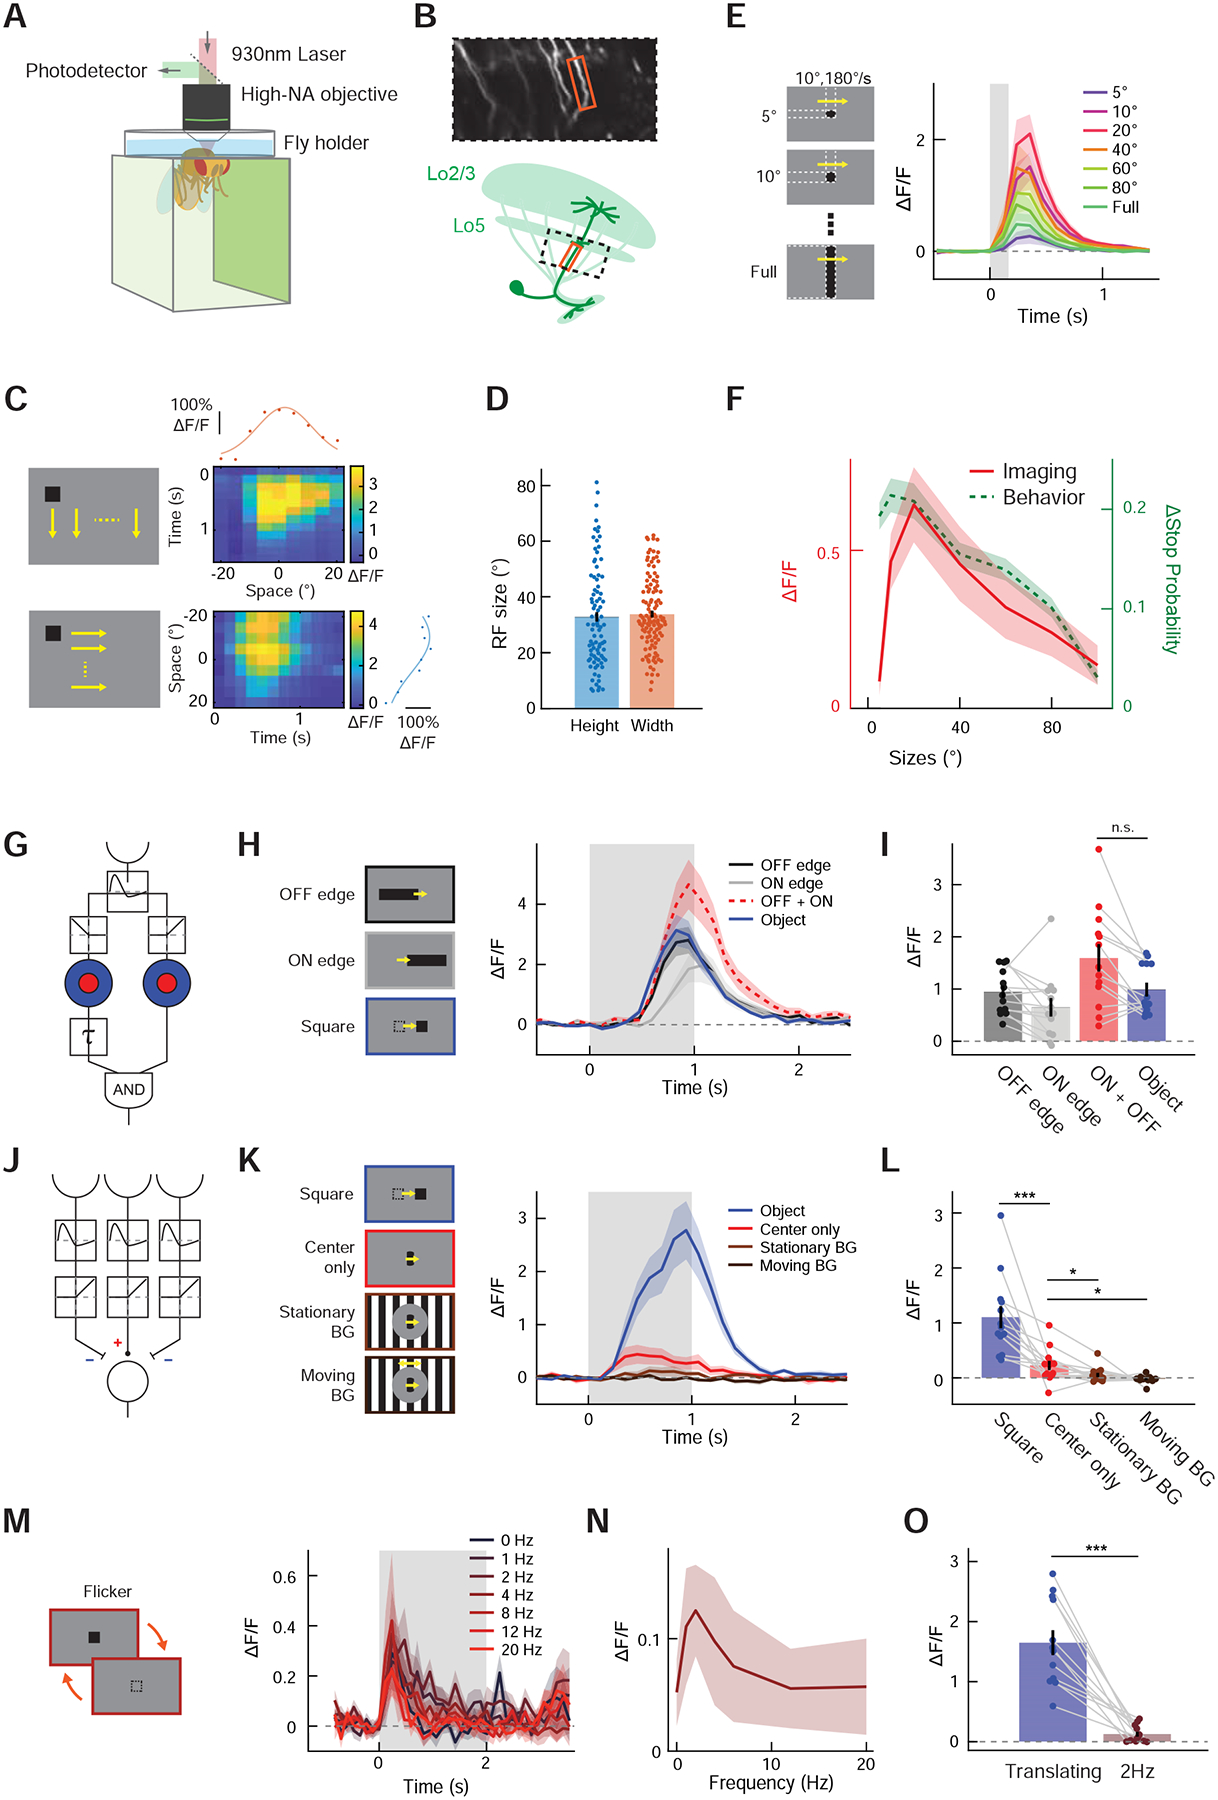
Figure 3. Existing models of small object detection do not explain response properties of LC11.

(A) Neuronal responses to visual stimuli projected on the panoramic screen were measured with two-photon microscopy. (B) (top) Frame from a typical recording during single-stalk LC11 calcium measurements. (bottom) Schematic showing the imaging region. At the region between proximal lobula and optic glomerulus, the main stalks of dendritic tree of individual LC11 cells are easily discernible. (C) (left) A single, 10° × 10° black square swept the visual field vertically (top) or horizontally (bottom) at different azimuths and elevations, with the resolution of 5°. (right) Calcium responses of a typical LC11 stalk to vertically (top) or horizontally (bottom) translating squares are shown as heatmaps. The calcium responses were averaged over time for each azimuth/elevation to generate horizontal/vertical spatial tuning curves of the stalk (red/blue dots), to which Gaussian functions were fitted (red/blue solid lines) to estimate the center and the width of each RF. (D) The size of horizontal and vertical RF, calculated as FWQM values of the Gaussian functions fitted to the spatial tuning curves. (E) (left) Stimuli used for size-tuning measurement, which were identical to those used in size-tuning measurement of stopping behavior (Figure 1I). (right) Average calcium responses of LC11 neurons to translating squares with different sizes. (F) Calcium response of LC11 to translating objects as the function of object size (red), averaged over 1 seconds after the stimulus onset. Overlaid on top is the size tuning curve of object-induced stopping behavior (green dotted, Figure 1J). (G) Schematic of STMD model [7,14]. The model detects small objects by computing coincidence between size-tuned ON signal with size-tuned and delayed OFF signal. See Figures S4A–D for expected responses of the STMD model to the stimuli used. (H) Average calcium responses of LC11 neurons to either translating decoupled edges or a black square, along with the simulated linear sum of ON- and OFF-edge responses. The STMD model predicts that the responses to an object (blue) is greater than the sum of responses to decoupled edges (red) (Figure S4B). (I) Calcium responses of LC11 to either a square or decoupled edges, averaged over 2 seconds after the stimulus onset. (J) Schematic of the OMS model [1], which features temporal high-pass filtering followed by a center-surround antagonism. See Figures S4A–D for expected responses of the OMS model to the stimuli used. (K) LC11’s calcium response to either a translating square or a localized, drifting square-wave grating, with or without stimuli in the background. The OMS model predicts that stimuli in the surround suppresses the response (red vs. light and dark brown), but does not predict the greater responses to translating objects than to localized gratings (blue vs. red) (Figure S4C). (L) Calcium responses of LC11 to translating squares and localized gratings, averaged over 2 seconds after the stimulus onset. (M) Average calcium responses of LC11 to flicker stimuli with various temporal frequencies. (N) Calcium responses of LC11 as a function of flicker frequency, averaged over 2 seconds after the stimulus onset. (O) Comparison of calcium responses of LC11 to a translating square and the same square flickering at 2 Hz. (C) n = 88, 115 cells for vertical and horizontal spatial tuning curves, respectively. (E) n = 13 cells. (H, I) n = 13 cells. (K, L) n = 13 cells. (M - O) n = 12 cells. n.s.: non-significant; * p<0.05; *** p < 0.001; **** p<0.0001 in Wilcoxon sign-rank test.
