
Figure 5. Calcium, voltage, and neurochemical imaging in LC11 dendrites.
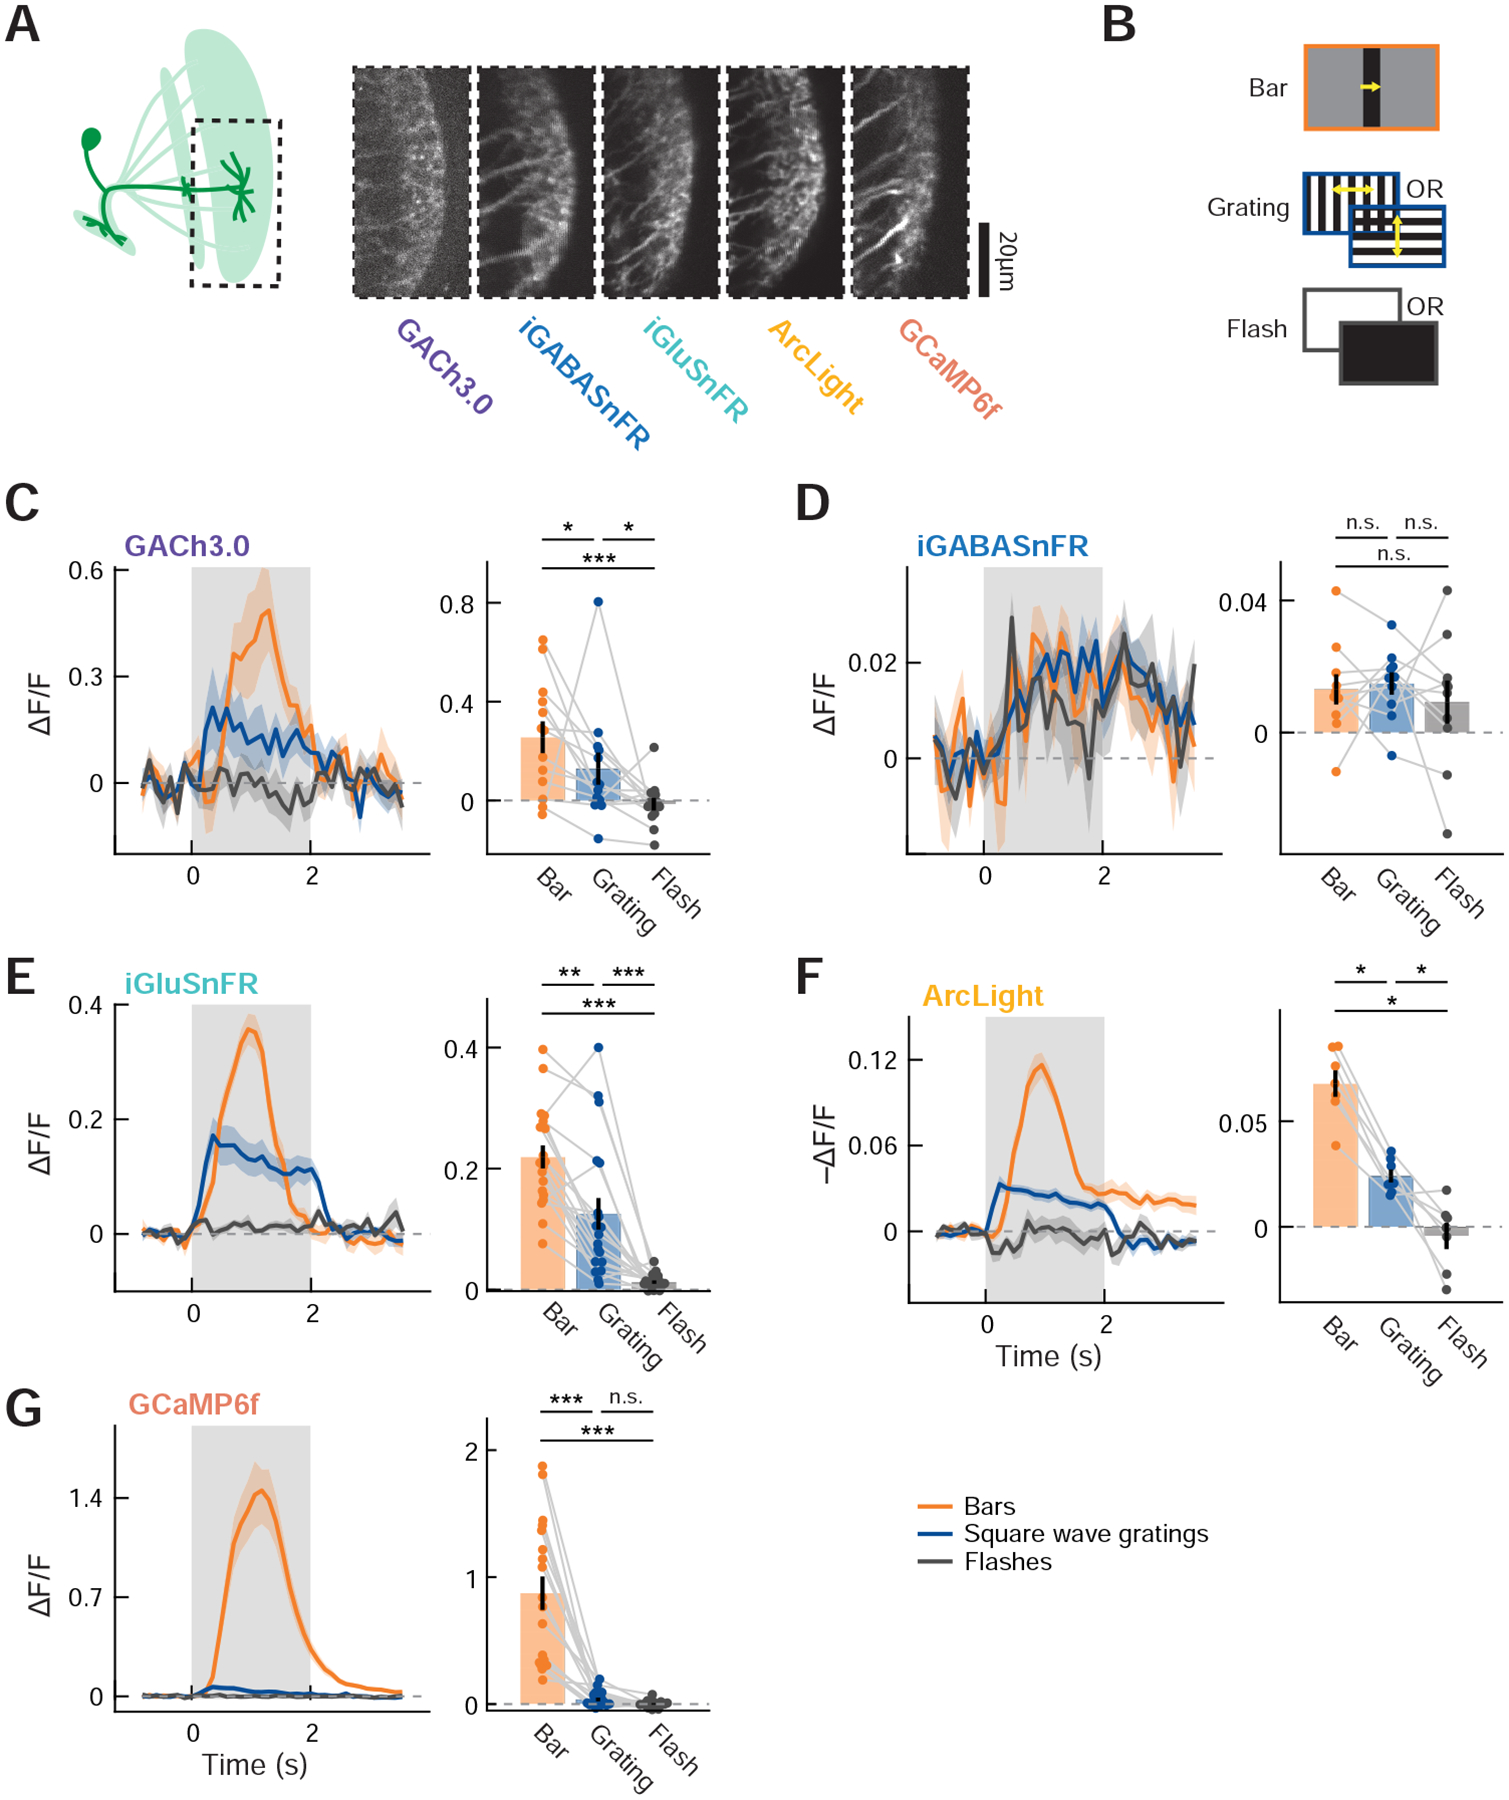
(A) (left) Distal dendrites of LC11 in Lo2/3 were imaged using the five indicators. (right) Frames from typical dendritic recordings using the five indicators. (B) Schematics of visual stimuli used. Bars moved either rightward or leftward, and the square wave grating moved in four cardinal directions. The responses to different directions of bar/grating and polarities of flash were averaged. (C – G) (left) Average responses of LC11 to the three types of stimuli, measured with (C) GACh3.0, (D) iGABASnFR, (E) iGluSnFR, (F) ArcLight, or (G) GCaMP6f. Note that since we did not align the responses according to the RF of each ROI, the kinetics of the responses to moving bars shown here are not representative of the kinetics of individual ROIs’ responses. (right) Time-averaged responses of LC11 to the three types of stimuli, measured with the five indicators. Temporal averaging windows were 0 to 1.5 s for bars, and 0 to 2 s for the rest. The data points from the same flies are connected with gray lines. (C) n = 13 flies, (D) n = 10 flies, (E) n = 19 flies, (F) n = 7 flies, and (G) n = 18 flies. n.s.: non-significant; * p<0.05; ** p < 0.01; *** p<0.001 in Wilcoxon sign-rank test.