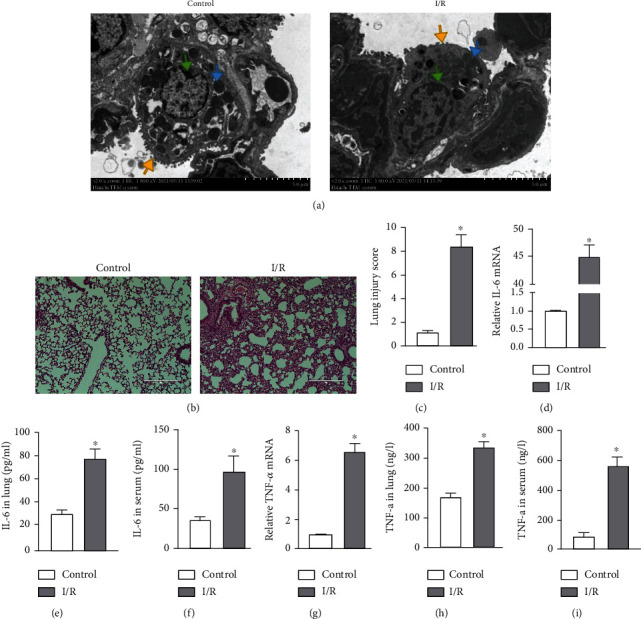
Figure 1.

Lung I/R induced inflammatory response and tissue injury. (a–i) Mouse lung tissue and serum collected from the control and I/R groups for the following experiments. (a) Transmission electron microscopy to evaluate ultrastructural changes: microvilli (yellow arrow), mitochondria (blue arrow), and nucleus (green arrow). Scale bar, 5 μm. (b) Evaluation of pathology by H&E staining. Scale bar, 100 μm. (c) Lung injury score based on H&E images. (d) IL-6 mRNA levels measured by RT-qPCR. (e, f) IL-6 levels in the lung and serum measured by ELISA. (g) TNF-α mRNA levels measured by RT-qPCR. (h, i) TNF-α level in the lung and serum measured by ELISA. The data are expressed as mean ± SEM (n = 7 per group). ∗P < 0.05 vs. the control group.
