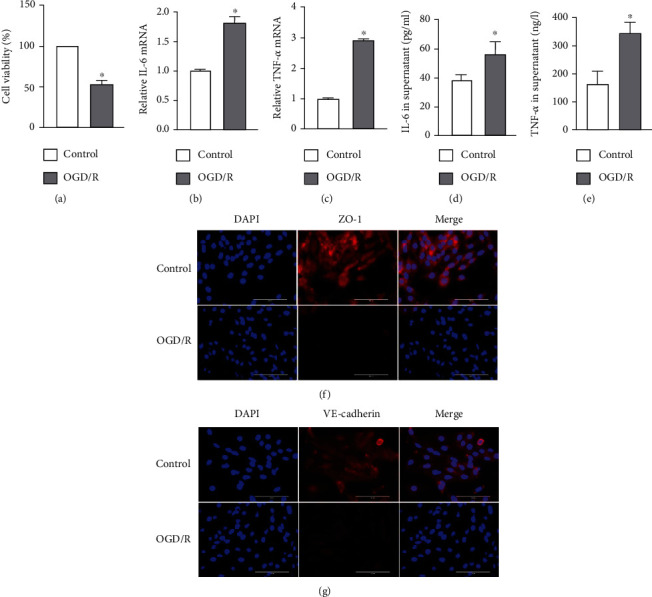
Figure 2.

OGD/R-induced endothelial barrier disruption and cell injury. (a–g) PMVECs and supernatant were collected from the control and OGD/R groups for the following experiments. (a) Viability of PMVECs assessed by CCK-8. (b, c) IL-6 and TNF-α mRNA levels measured by RT-qPCR. (d, e) IL-6 and TNF-α protein levels in cell supernatant measured by ELISA. (f, g) Immunofluorescence micrographs of PMVEC ZO-1 and VE-cadherin (red) identified by immunofluorescence. DAPI was used to stain the cell nuclei. Scale bar, 200 μm. The data are expressed as mean ± SEM. Each experiment was performed independently at least 3 times. ∗P < 0.05 vs. the control group.
