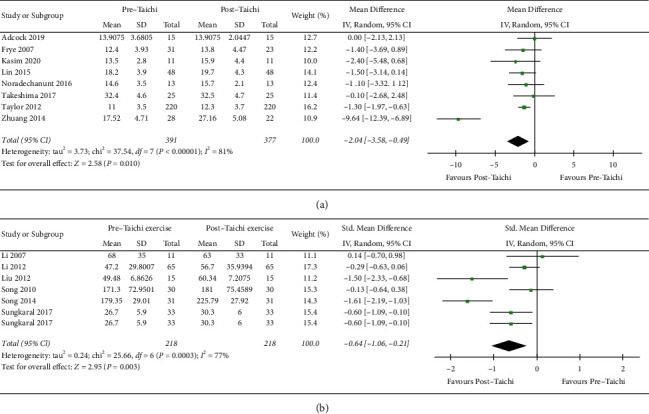
Figure 4.

Forest plot of comparison. Subgroup outcome of forest plot in Figure 3(a). (a) 30 s chair stand test method. (b) Other test methods.

Forest plot of comparison. Subgroup outcome of forest plot in Figure 3(a). (a) 30 s chair stand test method. (b) Other test methods.