Figure 4.

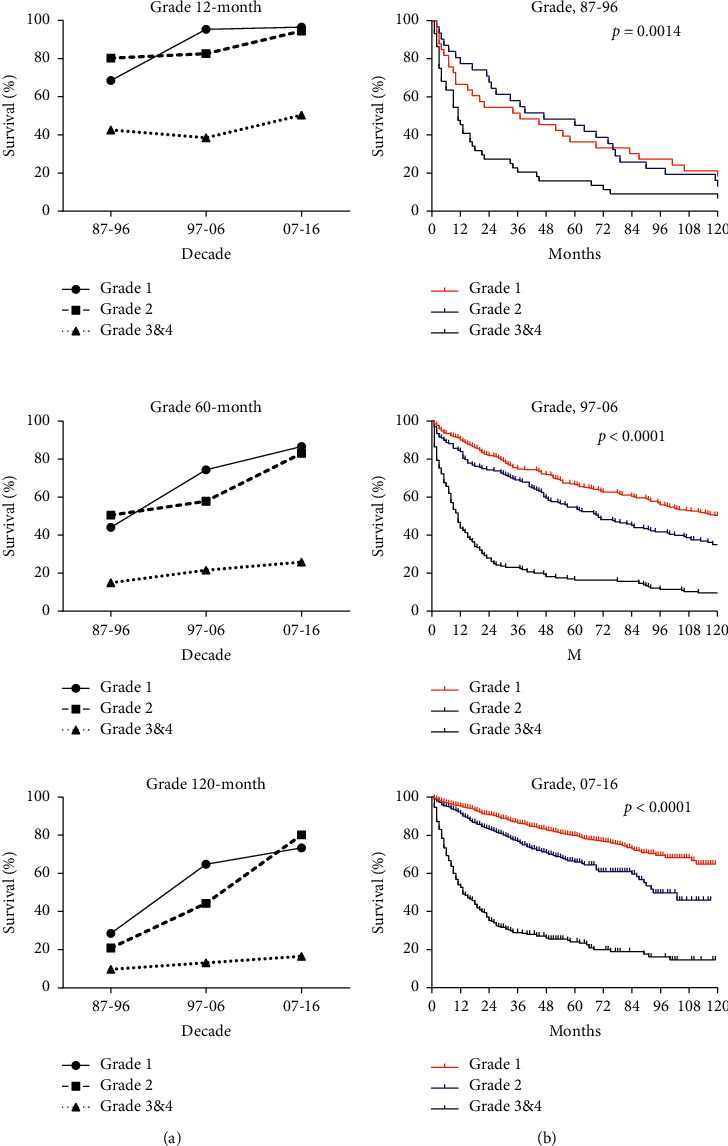
Trends in relative survival rate (a) and Kaplan–Meier survival curves (b) for patients with pNEN at 9 SEER sites according to grade group (grade 1, grade 2, and grade 3&4) in 1987–1996, 1997–2006, and 2007–2016.

Trends in relative survival rate (a) and Kaplan–Meier survival curves (b) for patients with pNEN at 9 SEER sites according to grade group (grade 1, grade 2, and grade 3&4) in 1987–1996, 1997–2006, and 2007–2016.