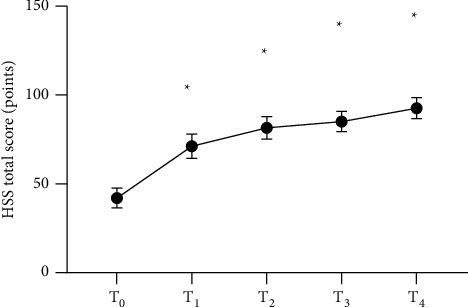
Figure 2.

Analysis of total HSS scores of patients (, points). The horizontal axis of from left to right represents before surgery (T0), 3 months after surgery (T1), 6 months after surgery (T2), 12 months after surgery (T3), and 24 months after surgery (T4), and the vertical axis represents the total HSS score (points). The total HSS scores at T0, T1, T2, T3, and T4 were (42.1 ± 5.6), (71.2 ± 6.9), (81.5 ± 6.3), (85.1 ± 5.7), and (92.6 ± 5.9), respectively. ∗Comparison of the time nodes after surgery with T0 (P < 0.05).
