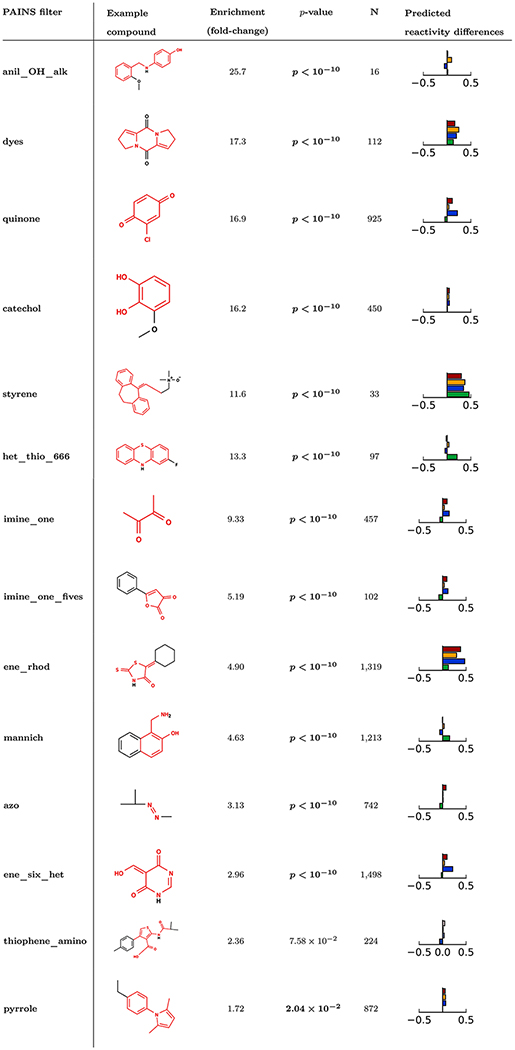
Table 1.
Selected PAINS Filter Groups That Are Enriched for Promiscuous Bioactives Compared to the Backgrounda

|
Enrichment scores in bold indicate statistically-significant enrichment for promiscuous bioactives above the background rate of 3.84% (p < 0.05, Bonferroni-corrected χ2 test). Example molecules shown are the lowest molecular weight match in PubChem to the given filter group. Substructures matched by the filter group are shown in red. In addition, the change in mean reactivity score between molecules matching the PAINS filter and those not matching is shown: cyanide (blue), GSH (green), DNA (orange), protein (red). A complete list of filter groups significantly enriched for promiscuous actives is provided in the supplementary material (Table S1). Filter groups are sorted by promiscuous activity enrichment fold change.
