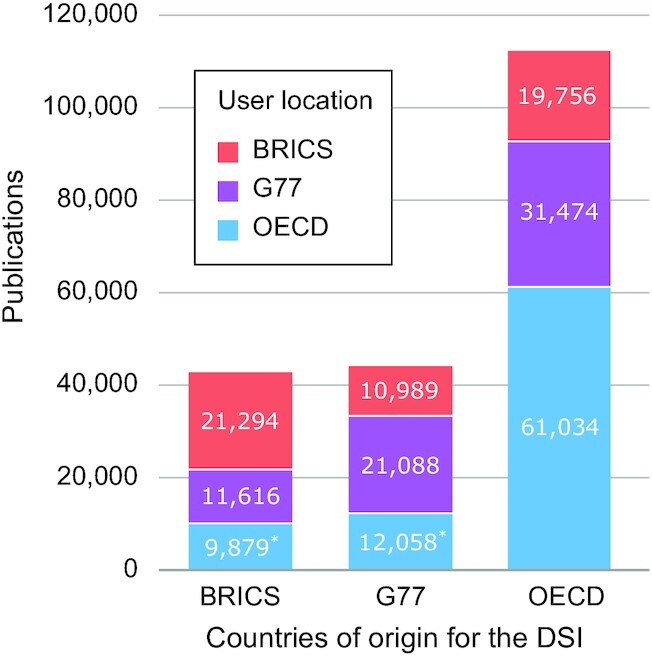
Figure 3.

DSI use by economic blocs. On the x-axis is the country of origin of the DSI (i.e., the “/country” field in the sequence database). On the y-axis are the total number of DSI-using publications, where the colour blocks represent the geographical location of the users (authors) grouped by economic blocs (i.e., OECD [proxy for developed countries], G77 [proxy for low-income countries], and BRICS [Brazil, Russia, China, India, and South Africa, proxy for large middle-income countries]). The asterisk indicates the subset of the DSI-based publications where the international call for benefit sharing is most focused and where concerns are heightened. An interactive chart is available on the web platform under Graph 5.1 [12].
