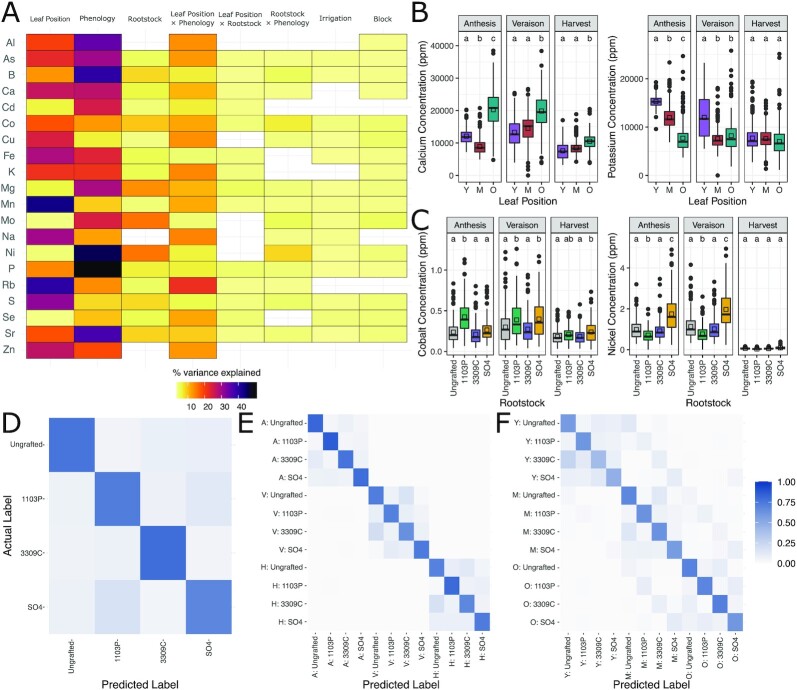
Figure 1:
The ionome shows strong signal from rootstock genotype, leaf position, and phenological stage. (A) Percent variation captured in linear models fit to each of 20 ions measured in the ionomics pipeline. Presence of a cell indicates the model term (top) was significant (FDR; padj < 0.05) for that ion (left). (B) Example ions shown to vary significantly by the interaction of leaf position (Y = Youngest, M = Middle, O = Oldest) and phenological stage in parts per million. Boxes are bound by 25th and 75th percentile with whiskers extending 1.5 IQR from the box. Dots indicate outliers. Significant changes are indicated by letters above boxes and are only meant for comparison within each phenological stage. Group means are displayed with black squares. (C) Example ions shown to vary significantly by the interaction of rootstock genotype and phenological stage in parts per million. Significant changes are indicated by letters above boxes and are only meant for comparison within each phenological stage. Boxes are bound by 25th and 75th percentile with whiskers extending 1.5 IQR from the box. Group means are displayed with black squares. Dots indicate outliers. (D) Standardized heat map for out-of-bag (OOB) predictions by a random forest trained to predict rootstock genotype, (E) the interaction between rootstock genotype by phenology, and (F) the interaction between rootstock genotype and leaf position.

