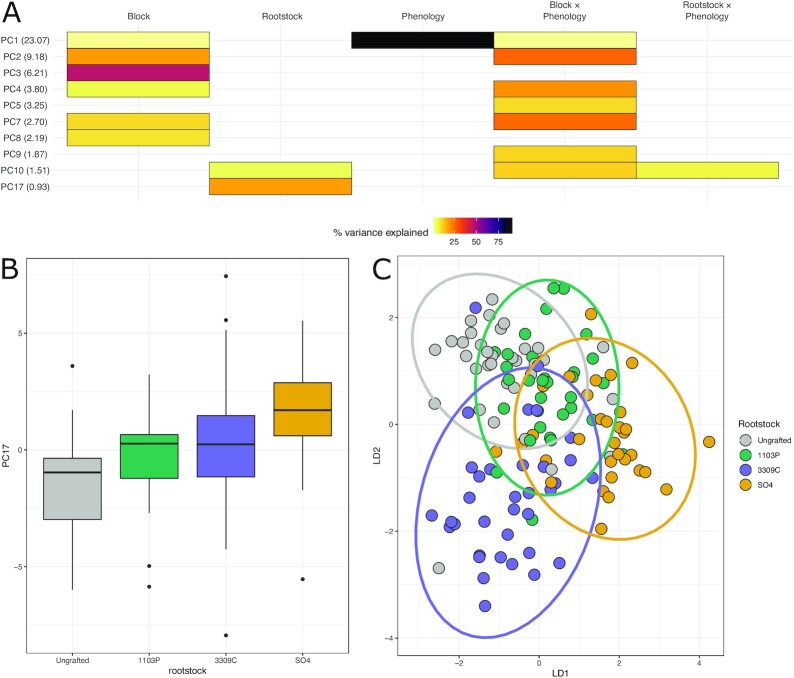
Figure 2:
The metabolome is influenced by rootstock genotype, phenological stage, and time of sampling. (A) Percent variation captured in linear models fit to each of the top 20 principal components (PCs) of the metabolome (661 measured metabolites). Presence of a cell indicates the model term (top) was significant for that PC (left, percent variation explained by the PC in parentheses). (B) The distribution of projections onto PC17, the strongest captured rootstock effect in the metabolome. Boxes are bound by the 25th and 75th percentiles with whiskers extending 1.5 IQR from the box. Dots indicate outliers. (C) Projections of all samples into the first 2 dimensions of a linear discriminant space trained to maximize variation between rootstock genotypes.

