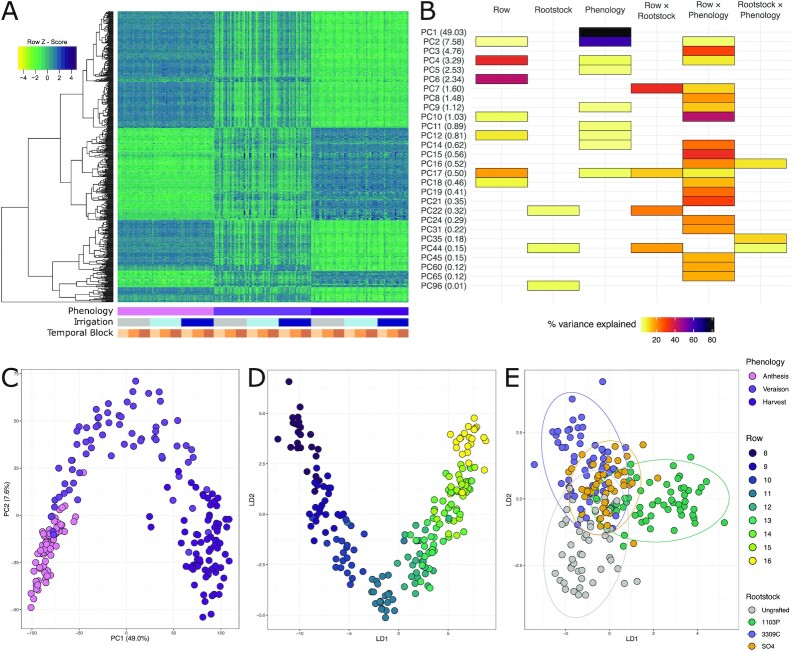
Figure 3:
Gene expression primarily responds to time of season and circadian correlates. (A) Heat map showing 500 genes with the highest variance following the filtering of genes with low expression levels and gene-by-gene variance stabilizing transformations (VST) ordered by example model factors (below). (B) Percent variation captured in linear models fit to the top 100 principal components (PCs) of the VST-transformed gene-expression space. Presence of a cell indicates that the model term (top) was significant for that PC (left, percent variation explained by the PC in parentheses). (C) Projections of all samples into the first 2 PC dimensions to show that the largest descriptors of variation are due to phenology. (D) Projections of all samples into the first 2 dimensions of the linear discriminant space trained to maximize variation between the rows of the vineyard, and (E) rootstock genotype.

