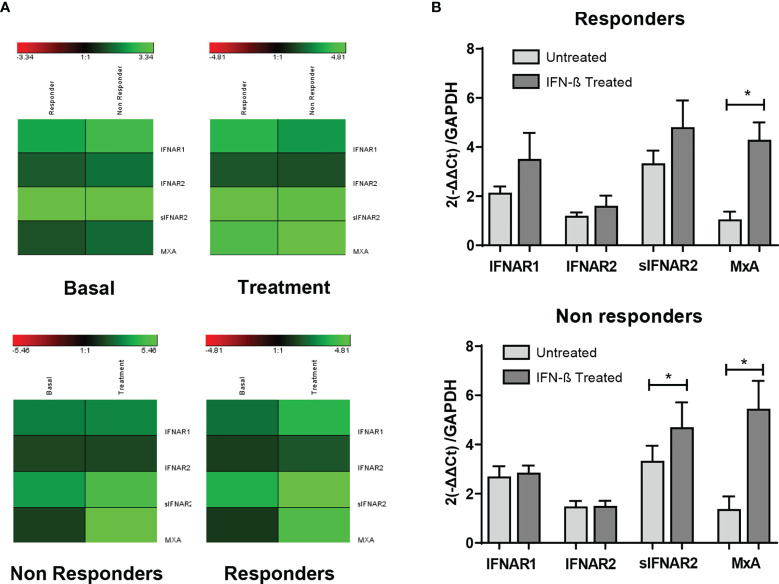
Figure 5.
Longitudinal assessment of IFNAR1, IFNAR2, sIFNAR2 and MxA gene expression in responder and non-responder patients. (A) Heat map representing the gene expression data of IFNAR1, IFNAR2, sIFNAR2, and MxA between responder and non-responder patients, at baseline and 6 months after the onset of IFN-β therapy. Unchanged proteins are displayed in black, up-regulated proteins are displayed in green while the down-regulated proteins are depicted in red. (B) Bar chart representing the gene expression for responders (N=22) and non-responders (N=19) using GAPDH as raeference gene. Significant p-values are shown with asterisk.

