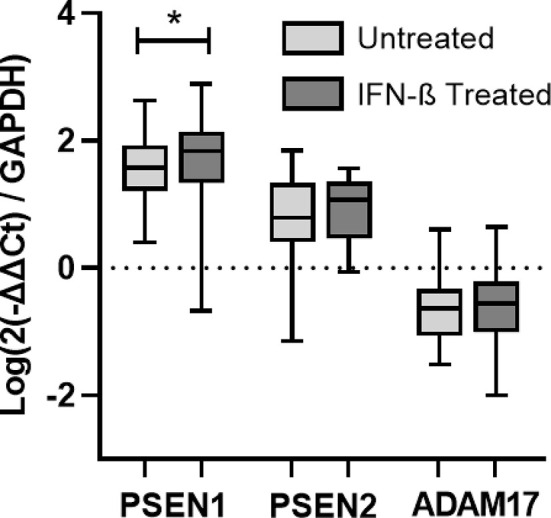
Figure 6.

Longitudinal assessment of PSEN1, PSEN2, and ADAM17 gene expression. RNA relative expression of PSEN1, PSEN2, and ADAM17 in PBMC from MS patients before and after 6 months of IFN-β treatment onset (N=41), assessed by real time-PCR using GAPDH as raeference gene. Significant p-values are shown with an asterisk. Logarithms are used to normalize and scale data for representation.
