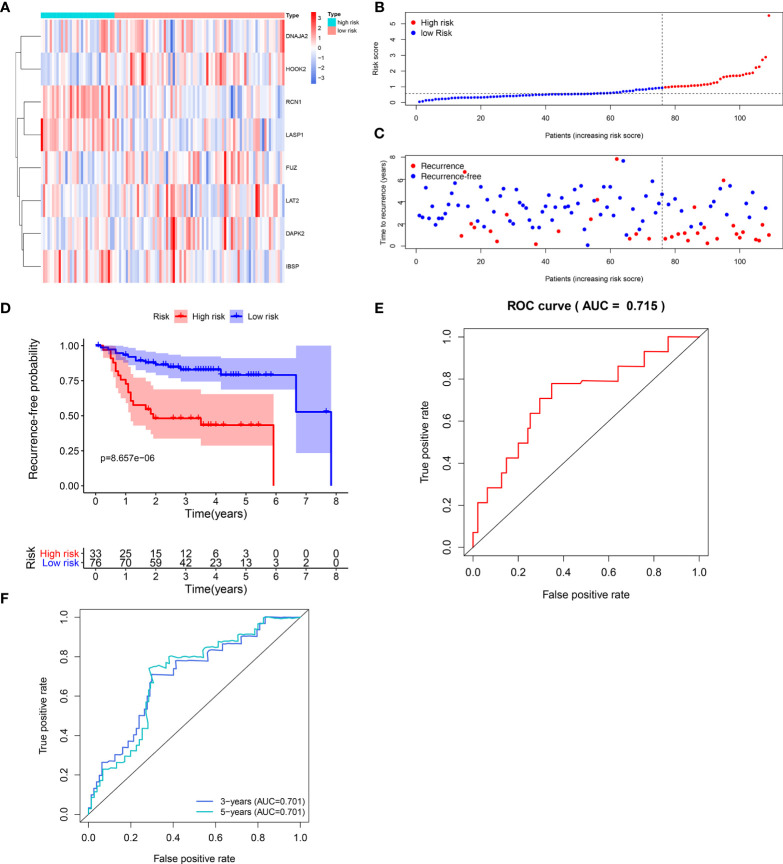
Figure 3.
Validation of the predictive efficacy of the signature for predicting recurrence of laryngeal cancer in the verification set. (A) Heat maps visualizing the differences expression patterns of these eight genes including RCN1, LAT2, DAPK2, DNAJA2, FUZ, LASP1, IBSP and HOOK2 between high- and low- risk score group. Red expresses up-regulation and blue indicates down-regulation. (B) Ranking of risk scores among all laryngeal cancer patients. (C) Distribution of recurrence time among all laryngeal cancer patients. Red dots express recurrence laryngeal cancer samples and blue dots represent non-recurrence samples. The dotted line indicates the optimal cutoff value of risk score. The left side of the line represents low-risk patients, while the right side represents high-risk patients. (D) Recurrence-free survival between high- and low- risk score groups. (E) ROC curve for predicting the patients’ 1-year recurrence. (F) ROC curves for predicting the patients’ 3 and 5-year recurrence.

