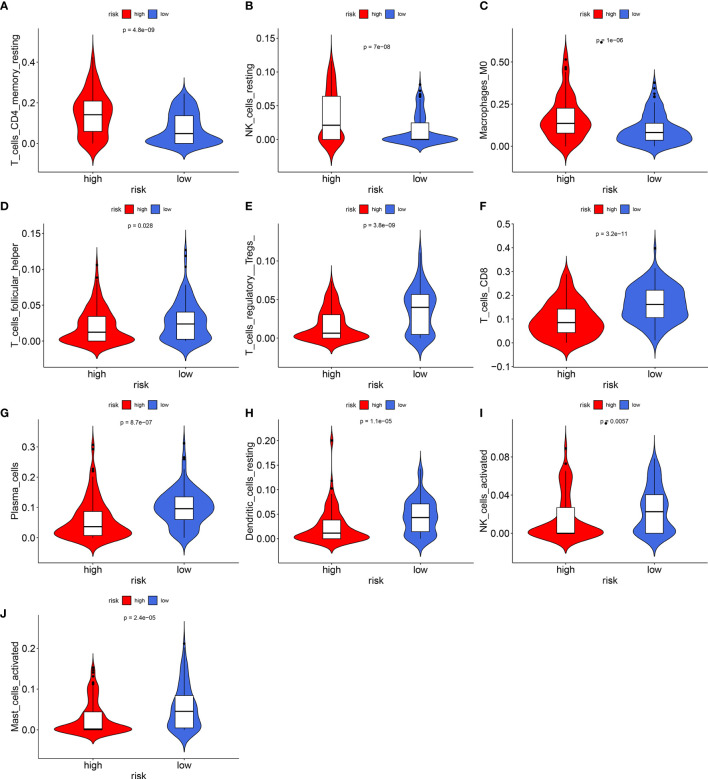
Figure 5.
Violin plots showing the relationship between the signature and infiltration levels of 22 kinds of immune cells. (A) T cells CD4 memory resting; (B) NK cells; (C) macrophage M0; (D) T cells follicular helper; (E) T cells regulatory; (F) T cells; (G) plasma cells; (H) dendritic cells; (I) NK cells; (J) mast cells activated. Red indicates high recurrence risk group and blue indicates low recurrence risk group.

