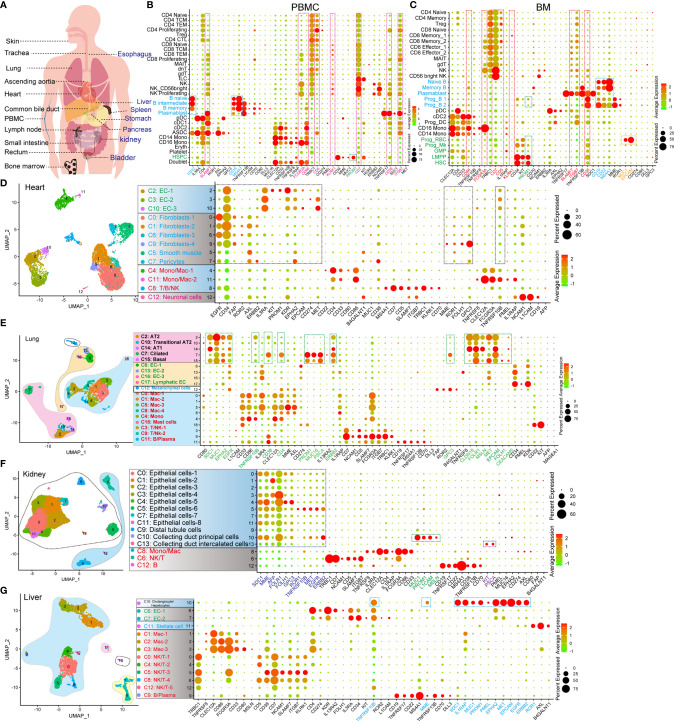
Figure 1.
Identification of the expression pattern of CAR target antigens in normal tissues and organs at single-cell transcriptome level. (A) Schematic representation of selected tissues and organs for analyzing target antigens. (B) Dot plot shows the expression levels of CAR target antigens in PBMCs. (C) Dot plot shows the expression levels of CAR target antigens in BM. UMAP projections of heart-derived cells (D), lung-derived cells (E), kidney-derived cells (F), and liver-derived cells (G), colored by clusters, and dot plots showing the expression level of CAR target antigens in different clusters.

