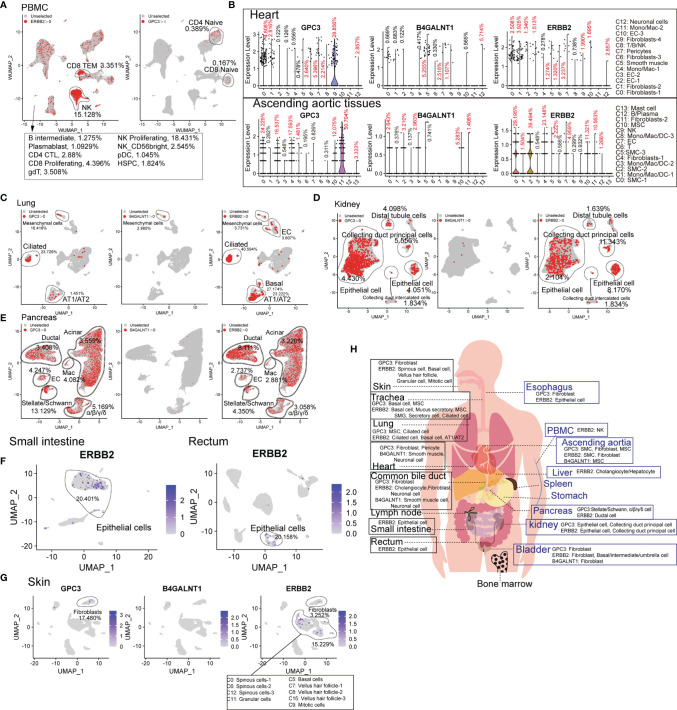
Figure 4.
Expression patterns of solid tumor antigens (GPC3, B4GALNT1, and ERBB2) in human normal tissues and organs. (A) GPC3 and ERBB2-expressing proportions (expression value >0) of PBMC-derived cells. (B) Violin plots show the expression levels of GPC3, B4GALNT1, and ERBB2 in heart-derived clusters and ascending aortic tissue-derived cells. GPC3, B4GALNT1, and ERBB2-expressing proportions (expression value >0) of lung-derived cells (C), kidney-derived cells (D), and pancreas-derived cells (E). (F) UMAP plots show the expression level of ERBB2 in small intestine-derived cells and rectum-derived cells. (G) UMAP plots show the expression levels of GPC3, B4GALNT1, and ERBB2, in skin-derived clusters. (H) Schematic diagram of high GPC3/B4GALNT1/ERBB2-expressing cell types in different tissues and organs.

